The Essence of Burch
2. Burch on lung cancer
The arrow of causation
Burch often begins his papers on smoking with the well-worn truth that correlation need not be causation. If smoking and lung cancer are correlated it may be that
- smoking causes cancer
- cancer causes smoking
- a third factor causes both
or a combination of all three (for instance genes and smoking might both be required to produce the disease). He expected a serious analysis to consider all three possibilities and estimate their relative contribution to the observed facts. In the 1970s he held that smoking causes at most 10% of lung cancer, that lung cancer does not cause the uptake of smoking, and that genes and misdiagnosis account for around 90% of reported cases of lung cancer. Further work in the 1980s eliminated smoking as a cause of lung cancer and his estimate of the genetic contribution to actual lung cancer was pretty much 100%.
He generally spoke of the “association” rather than the “correlation” between smoking and lung cancer, because different populations (male and female, white and non-white) have such different rates of lung cancer that the correlations with smoking do not even approximately overlap.
Does lung cancer cause smoking?
It is clear that the physiological processes which result in most forms of cancer, including lung cancer, unfold over decades. It is therefore a real question whether the onset of those processes results in an increased desire to smoke. Burch’s conclusions on this matter invoke a study by the smoking sceptic Richard Passey of 499 cases of lung cancer in men at two London hospitals in 1948-56 (the study was published in 1962). Among other things, Passey’s data seemed to show that the age at which the men started to smoke was uncorrelated with the age at which lung cancer was diagnosed. The data on the extremes was particularly striking: the 13 men who started smoking youngest, at 10 or younger, were diagnosed at an average age of 61.4±2 and the 14 men who started smoking oldest, at 26 or older, were diagnosed at an average age of 61.3±2.4. To Burch, this was strong evidence that there is no correlation either way between the onset of smoking and the onset of lung cancer.
The death rate
Ultimately the death rate is 100%, but what that phrase usually means is so many deaths per 100, 000 people per year or some such measure. That is how you compare deaths reported in populations of different size such as Greece and China or baby boomers and millennials. The death rate is a probability: the chance of dying in, say, the next year, for a given age, time and place. Specific diseases have their own death rates – the death rate from lung cancer, the death rate from heart disease and so on. Some diseases strike in youth or mid-life, but the death rate for the major killers, cancer, heart disease and degenerative disease, rises with advancing age, and so does the overall death rate. The need thus arises for a general measure which can be cited as the death rate from each disease regardless of age. The death rate at the average age of death is good enough for many purposes, but an analysis of the pattern of disease requires a finer-grained approach.
Data and description
Burch’s work on lung cancer relies in large part on two data sets: lung cancer rates among British men and women at five-year intervals from 1890 to 1970 (taken from publications of the Registrar General, the official record of births, marriages and deaths) and lung cancer rates in 24 national populations in 1960, taken from the work of Segi and Kurihara.
These data sets present reported totals of lung cancer deaths adjusted for population size. It is not a simple matter to devise a matching measure of lung cancer rates at different ages at one time and place, and Burch’s solution was to use his parameter S, explained here.
This stuck in the throats of his critics. S is part and parcel of the autoaggressive theory of disease in general, a hypothesis to be tested rather than established fact. In citing a hypothetical quantity as if it was data, surely he was assuming what he set out to prove? The answer is no. In his work on autoaggressive disease, the Weibull distribution is a prediction of some causal hypotheses and not others and its role is hypothesis testing. In the lung cancer papers, on the other hand, it is being used as descriptive statistics.
Burch found that his curve gave a good enough fit to the data for him to use it as a mathematical description of the data, independently of its origin in his general theory of disease. It would not greatly matter if Burch had used other measures to describe the data: for instance, he showed that an important calculation using S as a standardised death rate gave the same result when he used the better known standardised mortality/death rate (SMR/SDR). This would have been a wiser presentational strategy if his primary aim had been to refute Doll, but it was not: he wanted his research to be considered on its own merits. In Burch’s theory, S represents the percentage of the population seemingly (the qualification is crucial) at risk from lung cancer and k the rate at which the events producing cancer occur, and he discusses the matter in those terms. However, the curves would still fit the data if S and k had some other interpretation.
The papers are furnished with diagrams (the names given to them here are mine, not Burch’s) illustrating the main points of his argument. They are plotted logarithmically in the vertical scale and sometimes also in the horizontal scale for reasons involving the exponential decay function.
The Four Tides
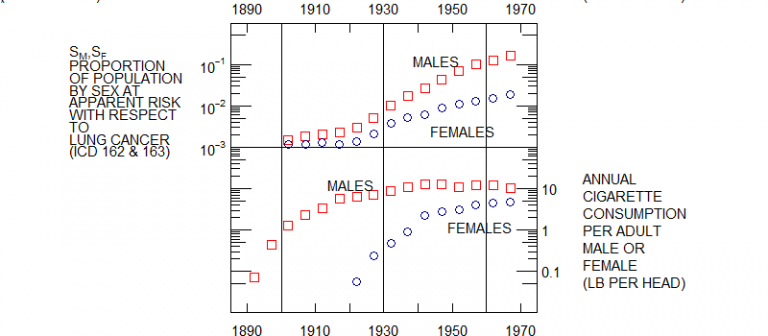
This is a plot of male and female lung cancer rates and male and female smoking rates in England and Wales from 1890 to 1970. The lung cancer rates seem to rise in tandem to 1930 and then diverge slightly while continuing to rise. But as for smoking, female smoking rates are negligible to 1920 and thereafter rise to converge with male rates.
The Twin Peaks
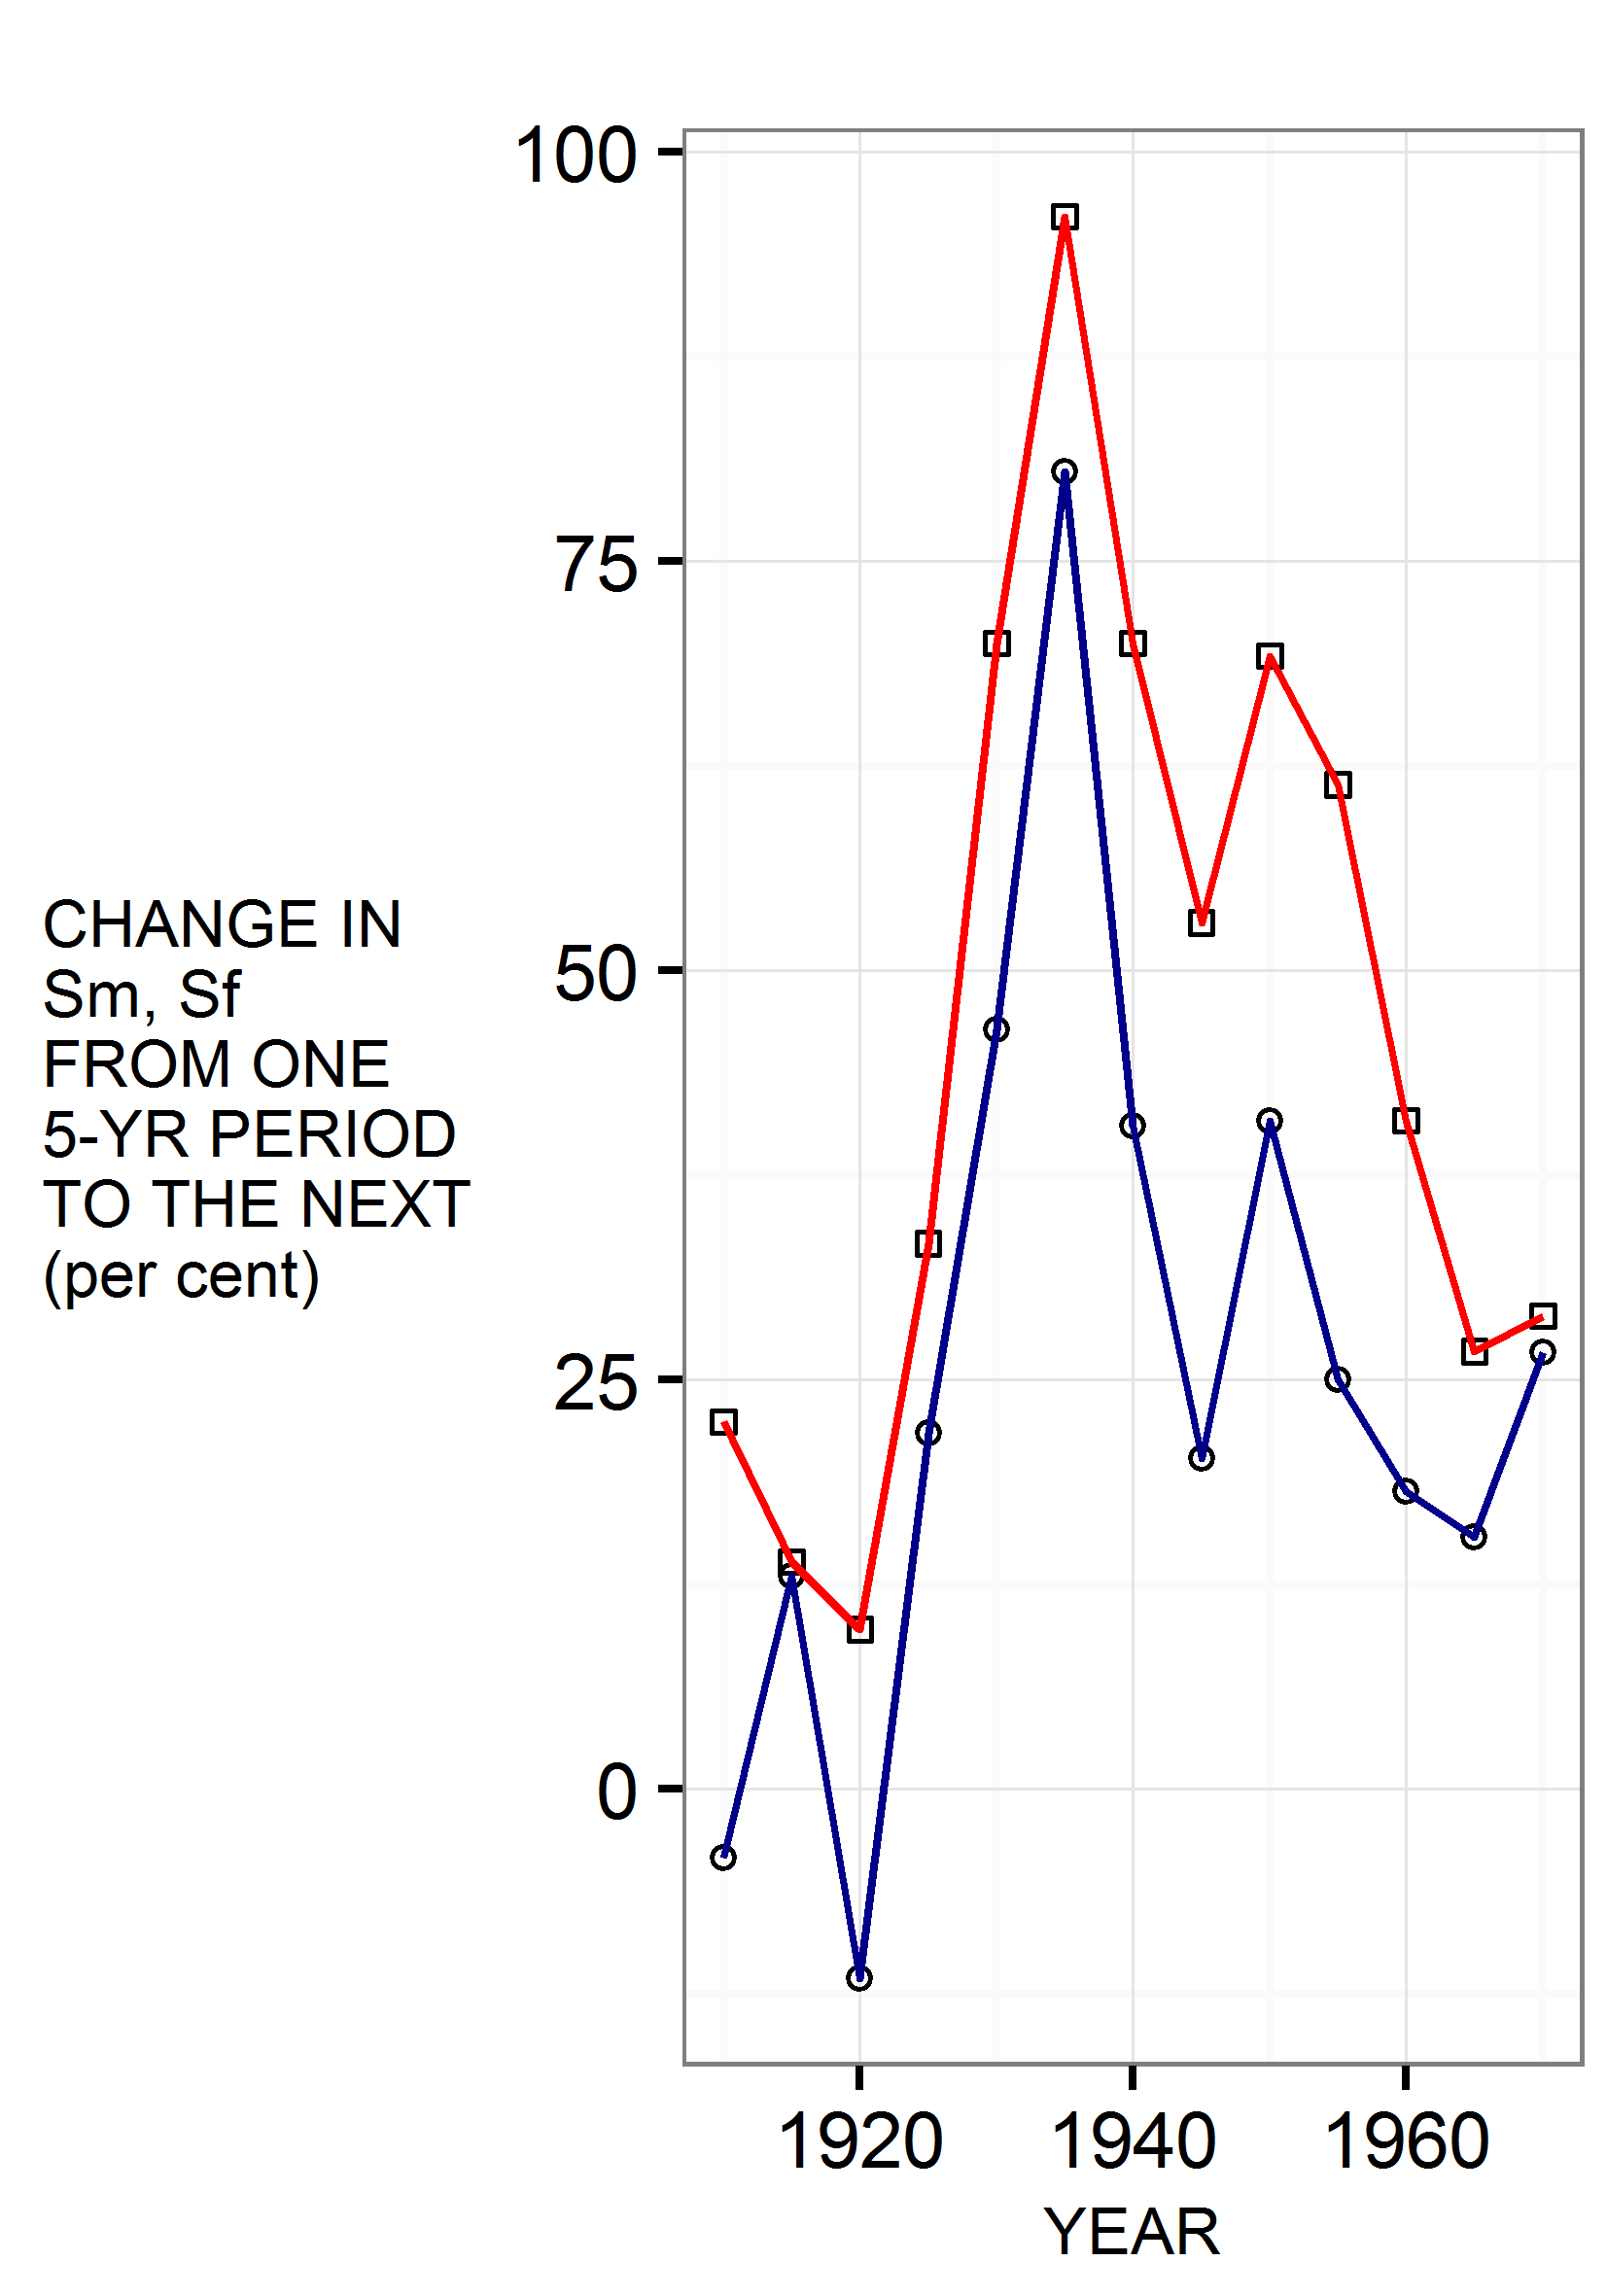
This diagram presents the same data on lung cancer as the previous one in a different and very striking way. It shows the difference between successive data points rather than their absolute values. Where the Four Tides diagram shows absolute rates changing over the decades, the Twin Peaks shows the changing rate of change. The difference is like that between the speedometer and accelerometer of a car. The one shows speed at any one time, now 40, now 50, now 60 miles an hour. The other shows whether speed is increasing or decreasing at any one time as the car accelerates and decelerates on its way forwards.
The astonishing thing is that male and female rates of lung cancer accelerate and decelerate in tandem, falling, rising, falling, rising and falling, with turning points in 1915, 1930, 1940 and 1945. This bears no resemblance to the usual story that female rates tracked male rates on a 30 year time delay. A replot with female rates shifted 30 years to the right showed no visible correlation at all.
The Burch Curve
The Burch Curve is the graph of the Weibull distribution with two parameters (n and r) assigned the values which best characterise the data for lung cancer in men and, separately, in women. Its shape resembles the path of a rocket at a fireworks display, a steeply rising arc suddenly cut off just after its descent begins. Its basis in Burch’s biological theories is explained here. The diagrams consist of the curve superimposed on actual data plotted as points. Three features are important.
- The steeply rising left hand limb, representing death rates up to the age of 50, indistinguishable from a straight line.
- The highest point of the arc, always distinct in the data points as well as the superimposed curve. Burch terms this the modal age of onset (modal as in mode, one statistical measure of the average).
- The brief but unarguable falling limb, cut short by lack of data on age groups above 85.
Both the rising limb of the curve and the modal peak distinguish between Doll’s analysis of the data and Burch’s. Doll’s model of the relationship of smoking and cancer can be plotted as a straight line on the same scale, but with a different slope and no modal peak.
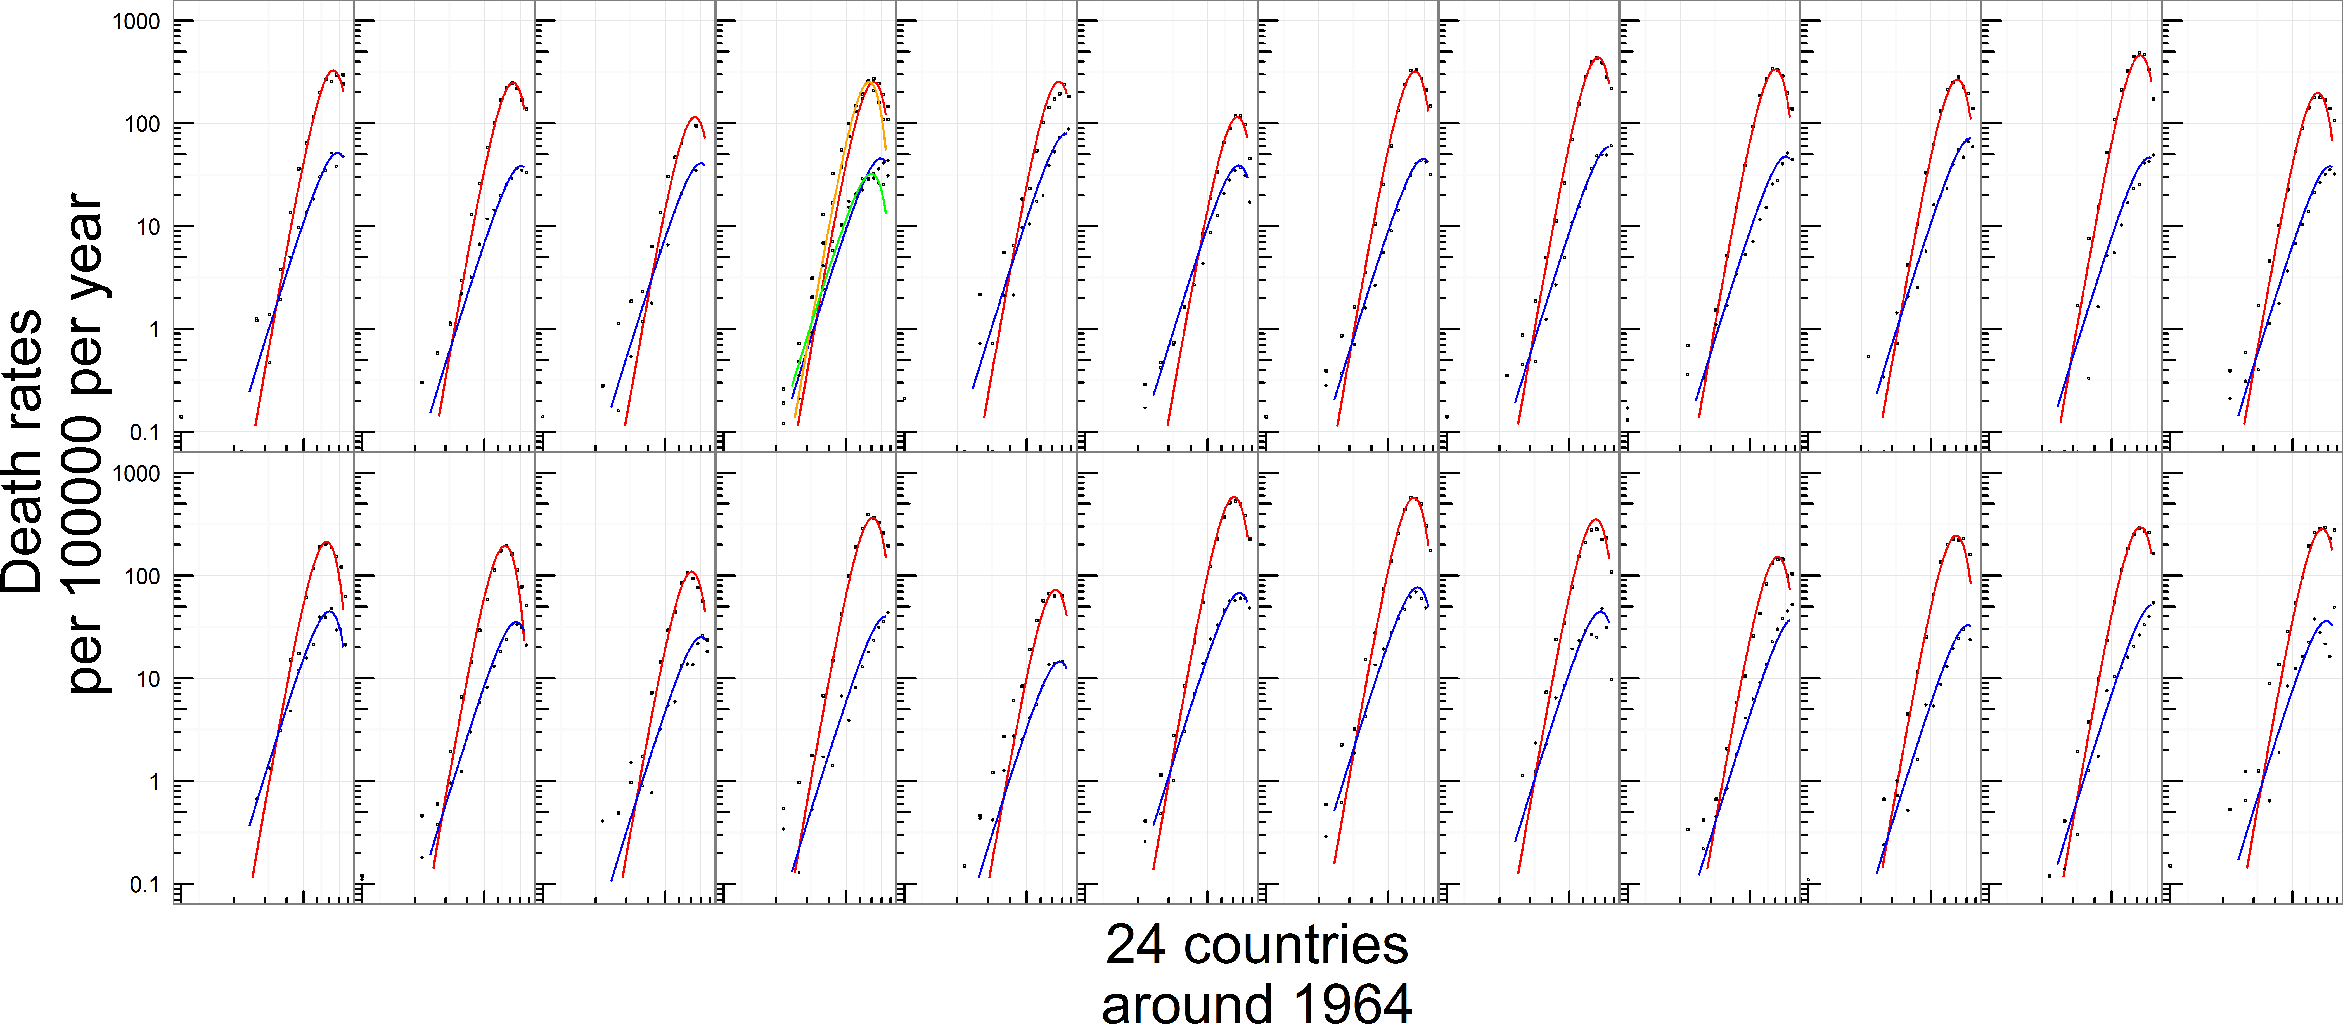
Movement without change
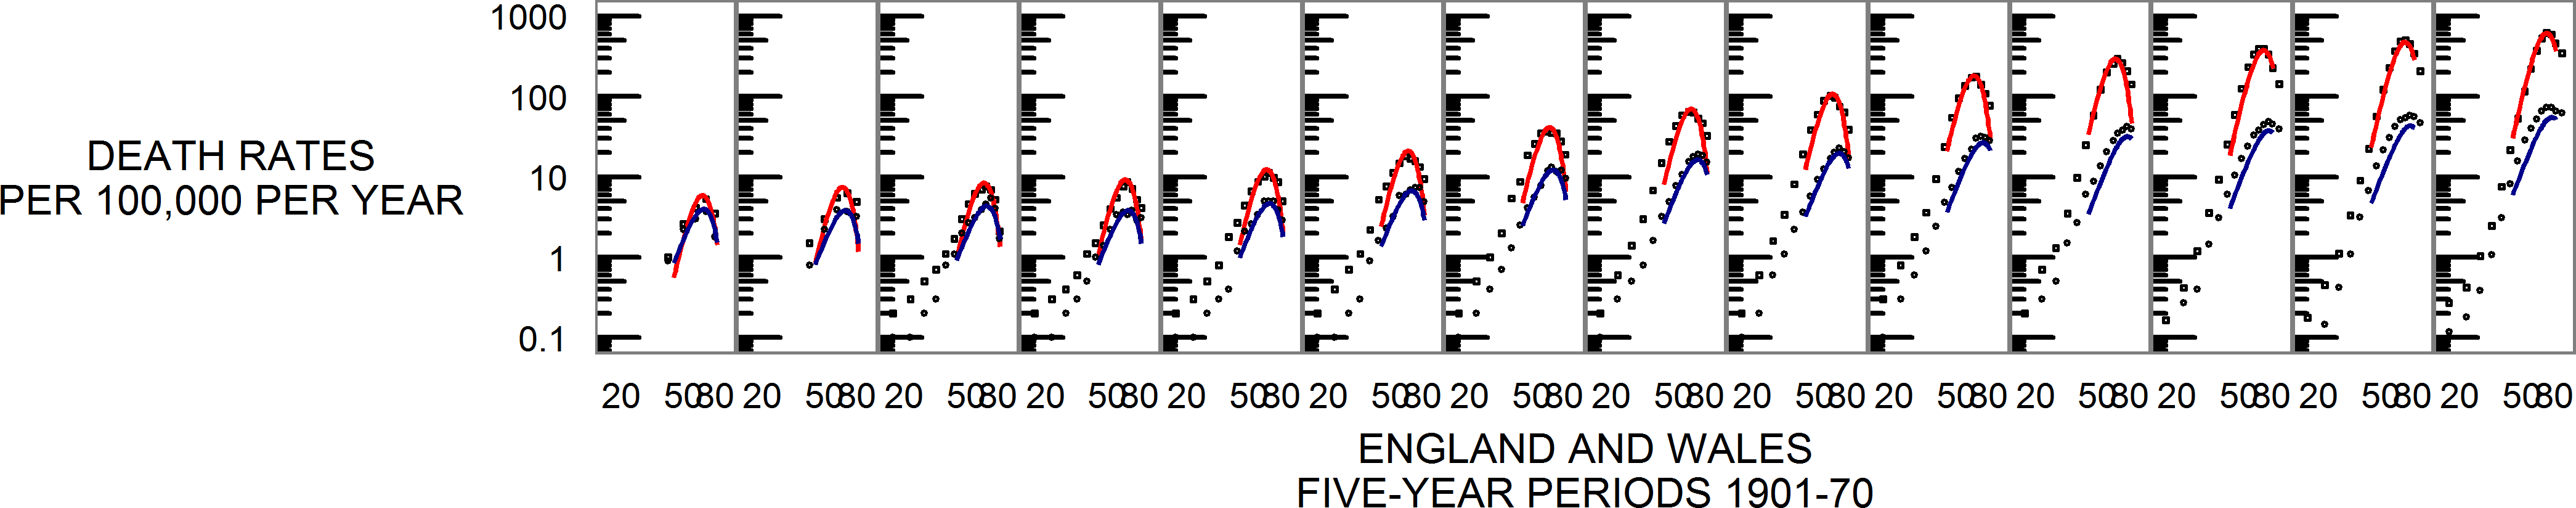
The full set of Burch Curve diagrams show the curve superimposed on points representing seven decades of British data and data on 24 countries in 1960. The curve slices through one panel of data points after another, fitting them impressively while never changing its distinctive shape. What does vary greatly is the size of the arc and, to a much lesser extent, its position on the charts. In Britain in the early 1930s the rocket peaked at around 50 deaths per 100, 000 a year, but in the late 1940s the corresponding figure is not 50 but 120. Something had happened in those two decades. It is well known that Japan has low lung cancer rates, but the rates for other, mostly western, countries in 1960 also varied enormously and showed no very strong correlation with smoking rates: yet the Burch curve fits the data excellently and the modal peak and decline in old age is always apparent.
Burch describes the decade on decade change and national differences in terms of S and k: a rise in the reported lung cancer death rate is an increase in S and a rise in the modal age of onset is a decrease in k (changes in the two are not entirely independent because of the invariant shape of the curve). Though Burch’s parameters are hypothetical, the facts he describes are real: it is his way of talking about the actual data. The main objective of his work on lung cancer is to test various explanations of the increase in S.
Initiator, promoter and precipitator

The obvious explanation of the rise in S is the increased consumption of cigarettes over the same period. However, Burch had already shown reasons to question the obvious, and he had more. Any plausible mechanism for the development of lung cancer involves a process with several stages, and he identified three classes of causal theory in which smoking acts as an initiator, promoter or precipitator of disease:
- Initiator: a causal factor is required to kick the process off.
- Promoter: a causal factor is involved in the transition between stages.
- Precipitator: a causal factor at the end of the process triggers the transition to malignancy.
Two of Burch’s publications – chapter 10 of The Biology of Cancer and the Zurich presentation Smoking and Lung Cancer: a Causal Connexion? – illustrate the predictions of each type of mechanism.
- Initiator should lower the modal age and raise the death rate (shift the curve left and upwards).
- Promoter should lower the modal age of onset (shift the curve left).
- Precipitator should raise the death rate (shift the curve upwards).
To Burch, these three changes translated into rising S and k, rising k and rising S. Since the British data shows a huge increase in S and a small decrease in k over the twentieth century to 1970, Burch regarded Precipitator as the only kind of causal theory worth further testing.
The Doll-Hill-Peto theory of smoking and lung cancer is a Promoter theory. Burch twice tested its predictions against the data and found it wanting for reasons discussed later.
Diagnosis and misdiagnosis
Burch thought that lung cancer was in large part a genetic disease. However, the startling rise in the lung cancer rate, as recorded on death certificates, could not possibly be the result of a lung cancer gene spreading through the population. It would be as if blue eyes were a rare phenomenon in 1900 and seen everywhere by mid-century.
His explanation was that the true rate of lung cancer had scarcely varied in the course of the twentieth century and that the rocketing increase in lung cancer diagnosis was actually an artefact of misdiagnosis. This was not a welcome suggestion and it was one reason why the medical profession was ill-disposed towards him. They had invested their considerable prestige in the decades-long campaign against smoking and naturally resented the idea that the whole thing was based on an enormous mistake.
Yet Burch had evidence to support his views. Specialists a century ago had reason to suspect that the then rare disease was much commoner than was appreciated at the time. The introduction of X-rays undoubtedly made a huge difference to diagnostic standards, and comparison of death certificates with necropsy results in the 1950s, 1960s and 1970s uncovered startling rates of both false positive and false negative diagnosis. There was also an increasing tendency over that period to overdiagnose lung cancer in smokers and underdiagnose it in non-smokers.
Midiagnosis and tuberculosis
Misdiagnosis of a disease must necessarily be misdiagnosis as some other disease. Metastasis of cancer from other sites to the lungs is common and is frequently misdiagnosed as primary cancer of the lung. In the USA, lung cancer did not appear in death records until 1923, and at that time lung diseases were mostly classified as pleurisy, pneumonia or tuberculosis. Tuberculosis is a prime candidate for misdiagnosed lung cancer in the earlier datasets, and became rare during the twentieth century inversely to the apparent rise of lung cancer. What is more, it was once common for actual tuberculosis to develop on top of actual lung cancer, and a diagram in The Biology of Cancer shows the Burch curve for lung cancer emerging in the later age groups in a plot of tuberculosis rates from youth to age.
Burch did not make a big issue out of tuberculosis in the work which went into The Biology of Cancer, but it comes to the fore in his investigations of the Precipitator hypothesis in the 1980s.
Smoking genes and cancer genes
Misdiagnosis aside, much lung cancer is real, and for all the reasons given so far Burch thought that the main cause of it is that genes for lung cancer have a strong tendency to crop up with genes for a love of smoking. Is this just a logical possibility, or is there any actual evidence? Indeed there is. Genetic diseases run in families, and even in the age of genomics studies of families remain important.
Burch often refers to a study by Tokuhata and Lilienfeld of 270 pairs of people chosen for general similarity between the pairs (age, sex, race…) but different in one crucial respect. The 270 individuals who had that characteristic were similar in other respects: more of them were smokers, they had a higher general death rate and a higher death rate from lung cancer even if they did not smoke. The characteristic that they were selected for was that they were a parent, sibling or child of a lung cancer patient (the closest degree of relatedness after identical twins). Obviously, close relatives share a similar environment as well as genes, but husbands and wives share one too, and the same pattern was not observed in the spouses of those 270 individuals.
Smoking and non-smoking twins
Studies of twins are in principle an even better test of the genetic contribution to smoking and lung cancer, but twins are few and studies tracking a large group over a lifetime cost a lot of money. The biggest study available when Burch wrote in the 1970s was Friberg and Cederlöf’s Swedish study, and the main conclusion it supported was that smoking is strongly influenced by genes. ‘Smoking discordant’ pairs of twins were few, and lung cancer is not a particularly common cause of death. As of 1977, there had been 16 lung cancer deaths in such pairs.
Twins are either monozygotic (‘identical’) or dizygotic (‘fraternal’), the difference being that monozygotics are (with qualifications which interested Burch greatly) genetically identical and dizygotics are not. This means that a pair of monozygotic twins either both have smoking genes or neither does and both have lung cancer genes or neither does. What if a smoker is a monozygotic twin of a non-smoker? The implication is that he or she is a social smoker who, like his or her twin, lacks the genes for smoking. If a smoker is a dizygotic twin of a non-smoker, there is no such implication either way.
For what it is worth, the 16 lung cancer deaths broke down like this:
| Dizygotic | Dizygotic | Monozygotic | Monozygotic |
|---|---|---|---|
| Non-smoker/light smoker | Heavy smoker | Non-smoker/light smoker | Heavy smoker |
| 2 | 10 | 2 | 2 |
The point is not that heavy smokers had more lung cancer than light smokers, but that dizygotics as a group were different from monozygotics. A sample of 16 deaths is too small to draw firm conclusions but such facts as there were supported the genetic hypothesis.
Fisher and methodology
The first smoking sceptic was Sir Ronald Fisher, the eminent statistician and geneticist. He did not question the association of smoking with lung cancer but dismissed the early work of Doll and Hill, proposing an explanation which they had overlooked, that people who are genetically prone to lung cancer are genetically prone to smoking as well. Then, the usual story goes, Fisher’s purely logical quibble was discredited as an increasing mass of evidence vindicated Doll and Hill’s view that smoking is the cause of lung cancer.
This is simply not what happened. Causation became orthodoxy in the years from 1956 to 1965. 1956, according the the Doll legend, was the year in which it was proved that smoking causes lung cancer. In Britain, results from five years of the Doctors’ Study convinced the medical establishment that Doll and Hill were right, and that soon became the view of the political class. An important victory occurred around 1957, when the industry-funded Tobacco Research Council embraced the causal theory and embarked on a programme of anti-smoking research.
In other countries, research on similar lines began to appear. This accumulating body of work furnished the material for the first official reports by the Royal College of Physicians in 1962 and the Surgeon General in 1964. Fisher was no longer alive to comment on them (he died in 1962), but a critique of the 1964 report for the American Statistical Association by K. A. Brownlee identified the same flawed reasoning as before: correlation hastily identified with causation, and a strategy of confirmation not refutation.
Brownlee’s arguments fell on deaf ears, for Doll and Hill had taught medicine a novel scientific methodology. The Surgeon General’s report briefly set out five principles by which a factor could be identified as a cause of disease (they were consistency, strength, specificity, temporal relationship and coherence). The same list in expanded form was the substance of a lecture by Hill in 1965 (he added items such as plausibility and analogy). Hill and the Surgeon General both claimed that a strong association is more likely to be causal than a weak one. Hill asserted that tests of significance were superfluous when the evidence was “clear-cut” and that lower standards of evidence applied in occupational medicine because “our object is usually to take action”.
Burch examined the Surgeon General’s methodology in a paper of 1982 and easily showed that it was vague, subjective and incompatible with the principle of falsification established by Sir Karl Popper. But this came far too late: epidemiology had decided to turn itself into a soft science with political aims, and that is what it had become.
Precipitator
Burch was a Popperian who aimed to falsify hypotheses not confirm them. At the close of the 1970s he considered that cigarettes could only possibly cause lung cancer as ‘precipitators’, acting at the end of the long process of carcinogenesis to precipitate malignancy. He also held that the only tenable dose-response relationship was linear. This meant that his tests of the Precipitator hypothesis, like those of Doll’s Promoter theory, used data on the entire population, not the sub-population of smokers.
In evaluating the Promoter hypothesis, he had started with the increase in the number of cigarettes smoked and arrived at a roughly twofold expected increase in lung cancer deaths. In assessing Precipitator, he calculated the number of cigarettes required to double the number of lung cancer deaths and compared the result with actual changes in smoking rates and death rates.
Smoking and lung cancer: tests of a causal hypothesis (1979) presents the calculation and compares it with actual data on changes in the smoking rate and changes in the lung cancer rate between the early 1950s and early 1960s, separately for men and women. The diagrams in this and the other Precipitator papers plot change against change, accelerometer reading against accelerometer reading and track the trend over time.
Smoking and mortality in England and Wales 1950 to 1976 (1981) applies the same mathematics and reasoning to death from all causes over a longer period of time. Smoking was supposed to be one of the main causes of death overall, so why not just study the death rate and sidestep the issue of misdiagnosis. Burch shows, more or less in passing, that the main reason for increasing lifespans over the twentieth century was the near elimination of tuberculosis.
Period and cohort trends for mortality and cigarette consumption in England and Wales, 1946 to 1980, with an emphasis on sex ratios (1987) applies the same procedure to 35 years worth of data, and instead of analysing male and female trends separately studies the ratio between them.
In each study, no clear pattern appears. Plots of smoking rates against death rates over time have the appearance of a drunken walk, and as for the rate of smoking required to double the death rate, there is no sign of it. At times, cigarettes would have to have had anti-carcinogenic properties to account for the facts. To quote the conclusions of the last paper:
Either the fatal consequences of smoking are fortuitously concealed by counter factors or few if any consequences exist to be hidden. In either eventuality, factors other than smoking had a large influence on mortality and hence doubt must arise as to whether “smoking is the largest preventable cause of death”… Anti-smoking evangelists, on the other hand, have converted a difficult scientific problem into a simple moral issue. I can only regret and deplore their current triumph.
Burch died in 1987 and the paper was published posthumously. That was his last word on the matter.
The Burch Curve: seven decades, full set of graphs
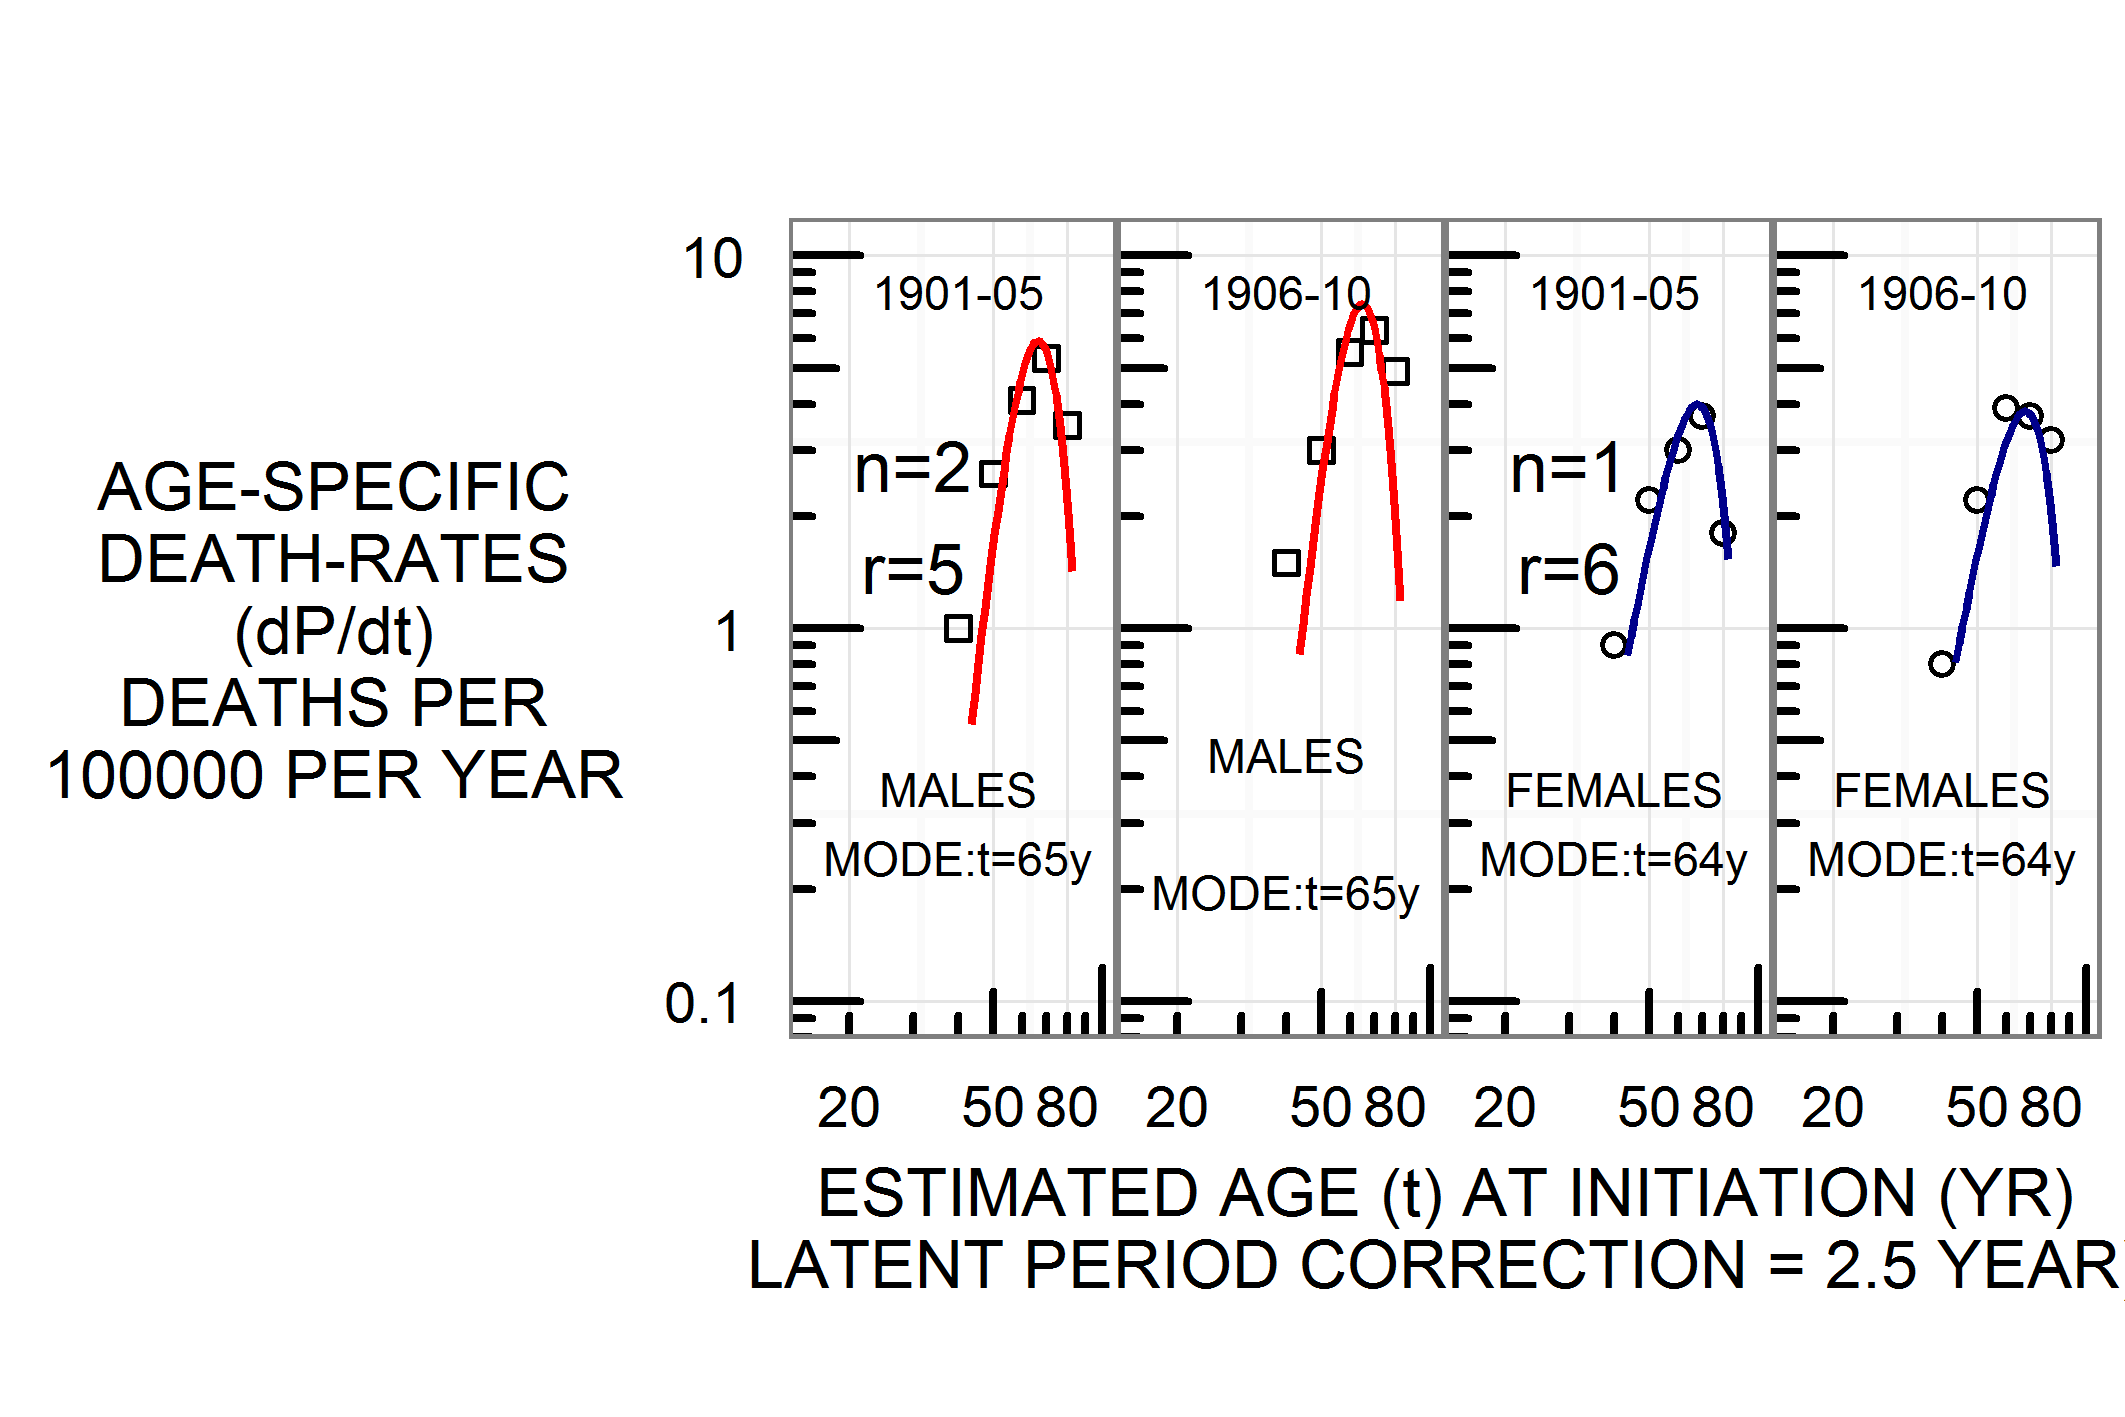
Fig. 2.6: Lung cancer deaths in England and Wales, 1901-10, male and female.
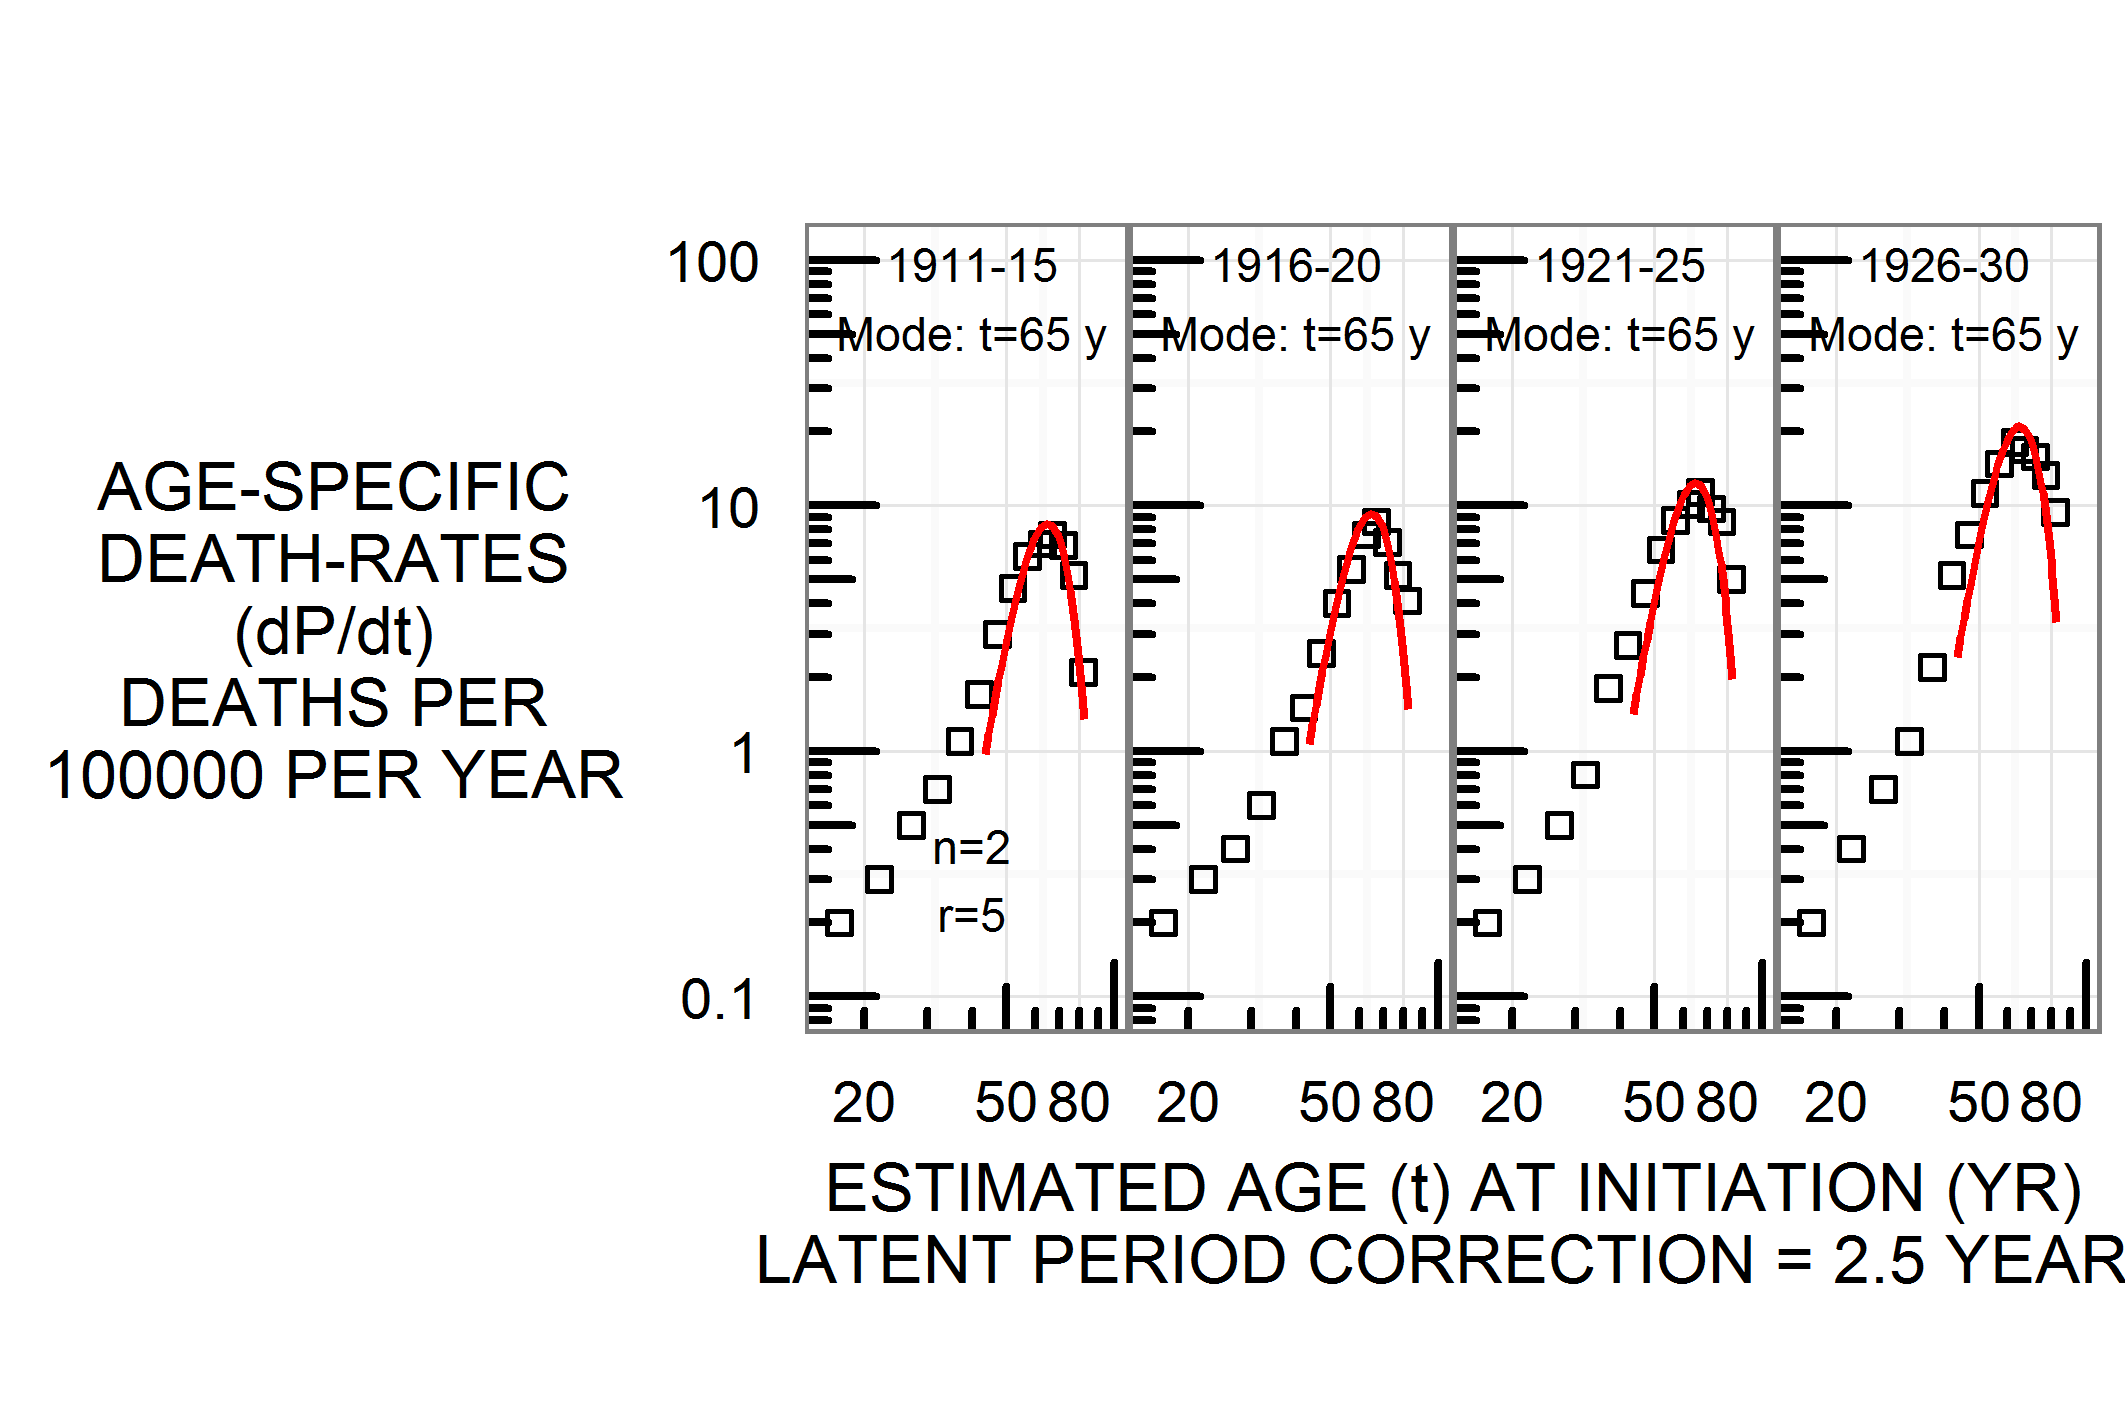
Fig. 2.7: Lung cancer deaths in England and Wales, 1911-1930, male.
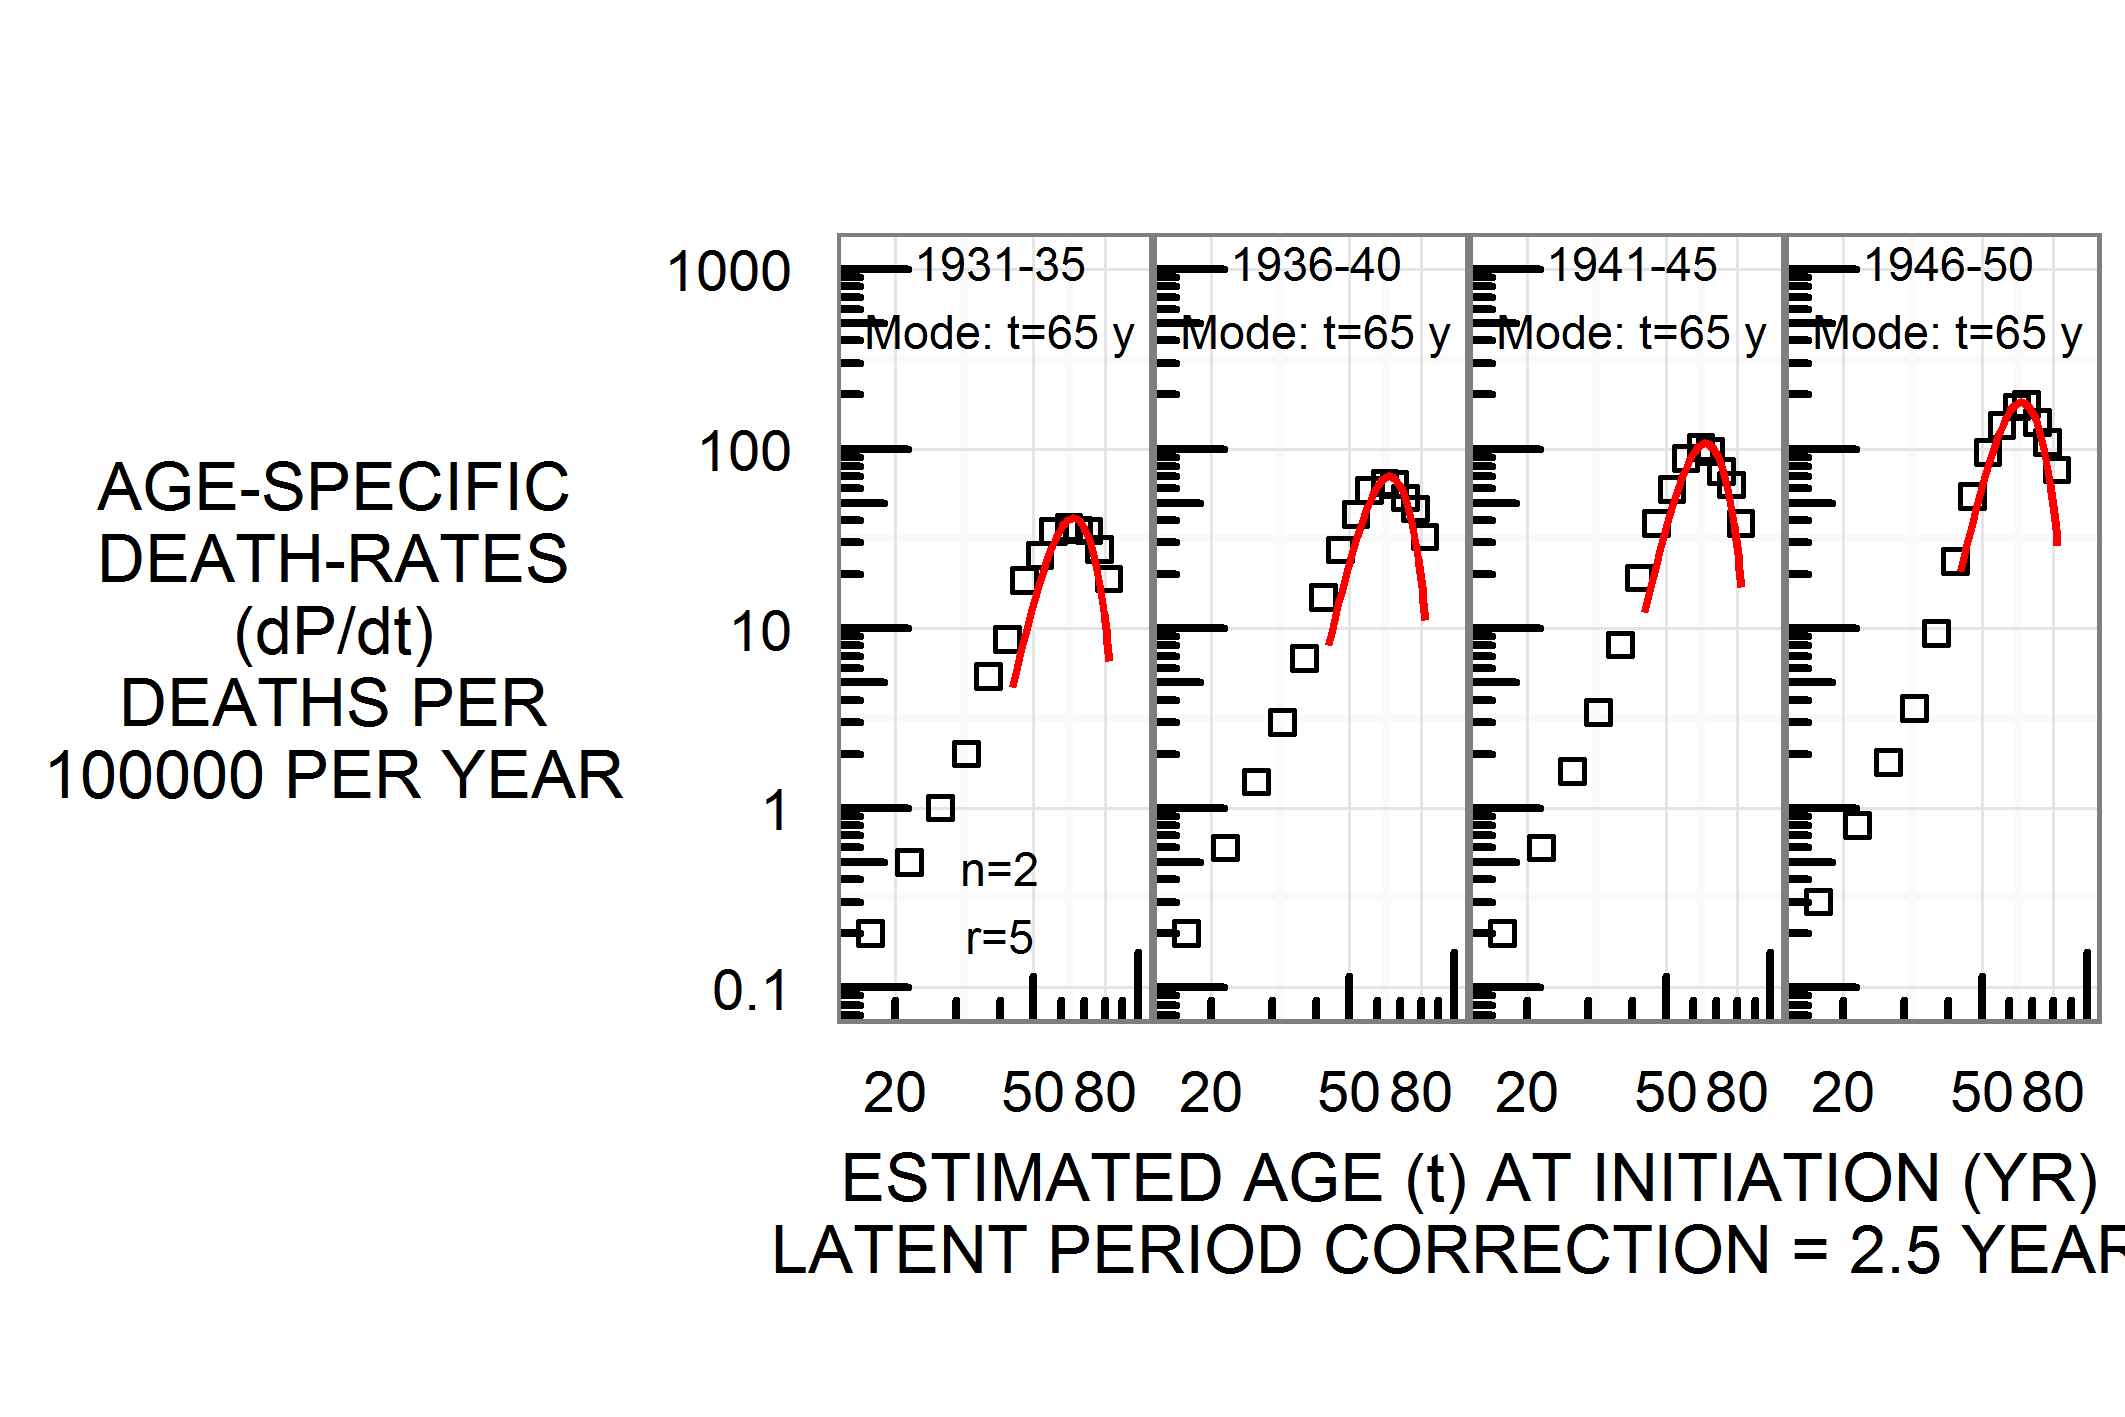
Fig. 2.8: Lung cancer deaths in England and Wales, 1931-1950, male.
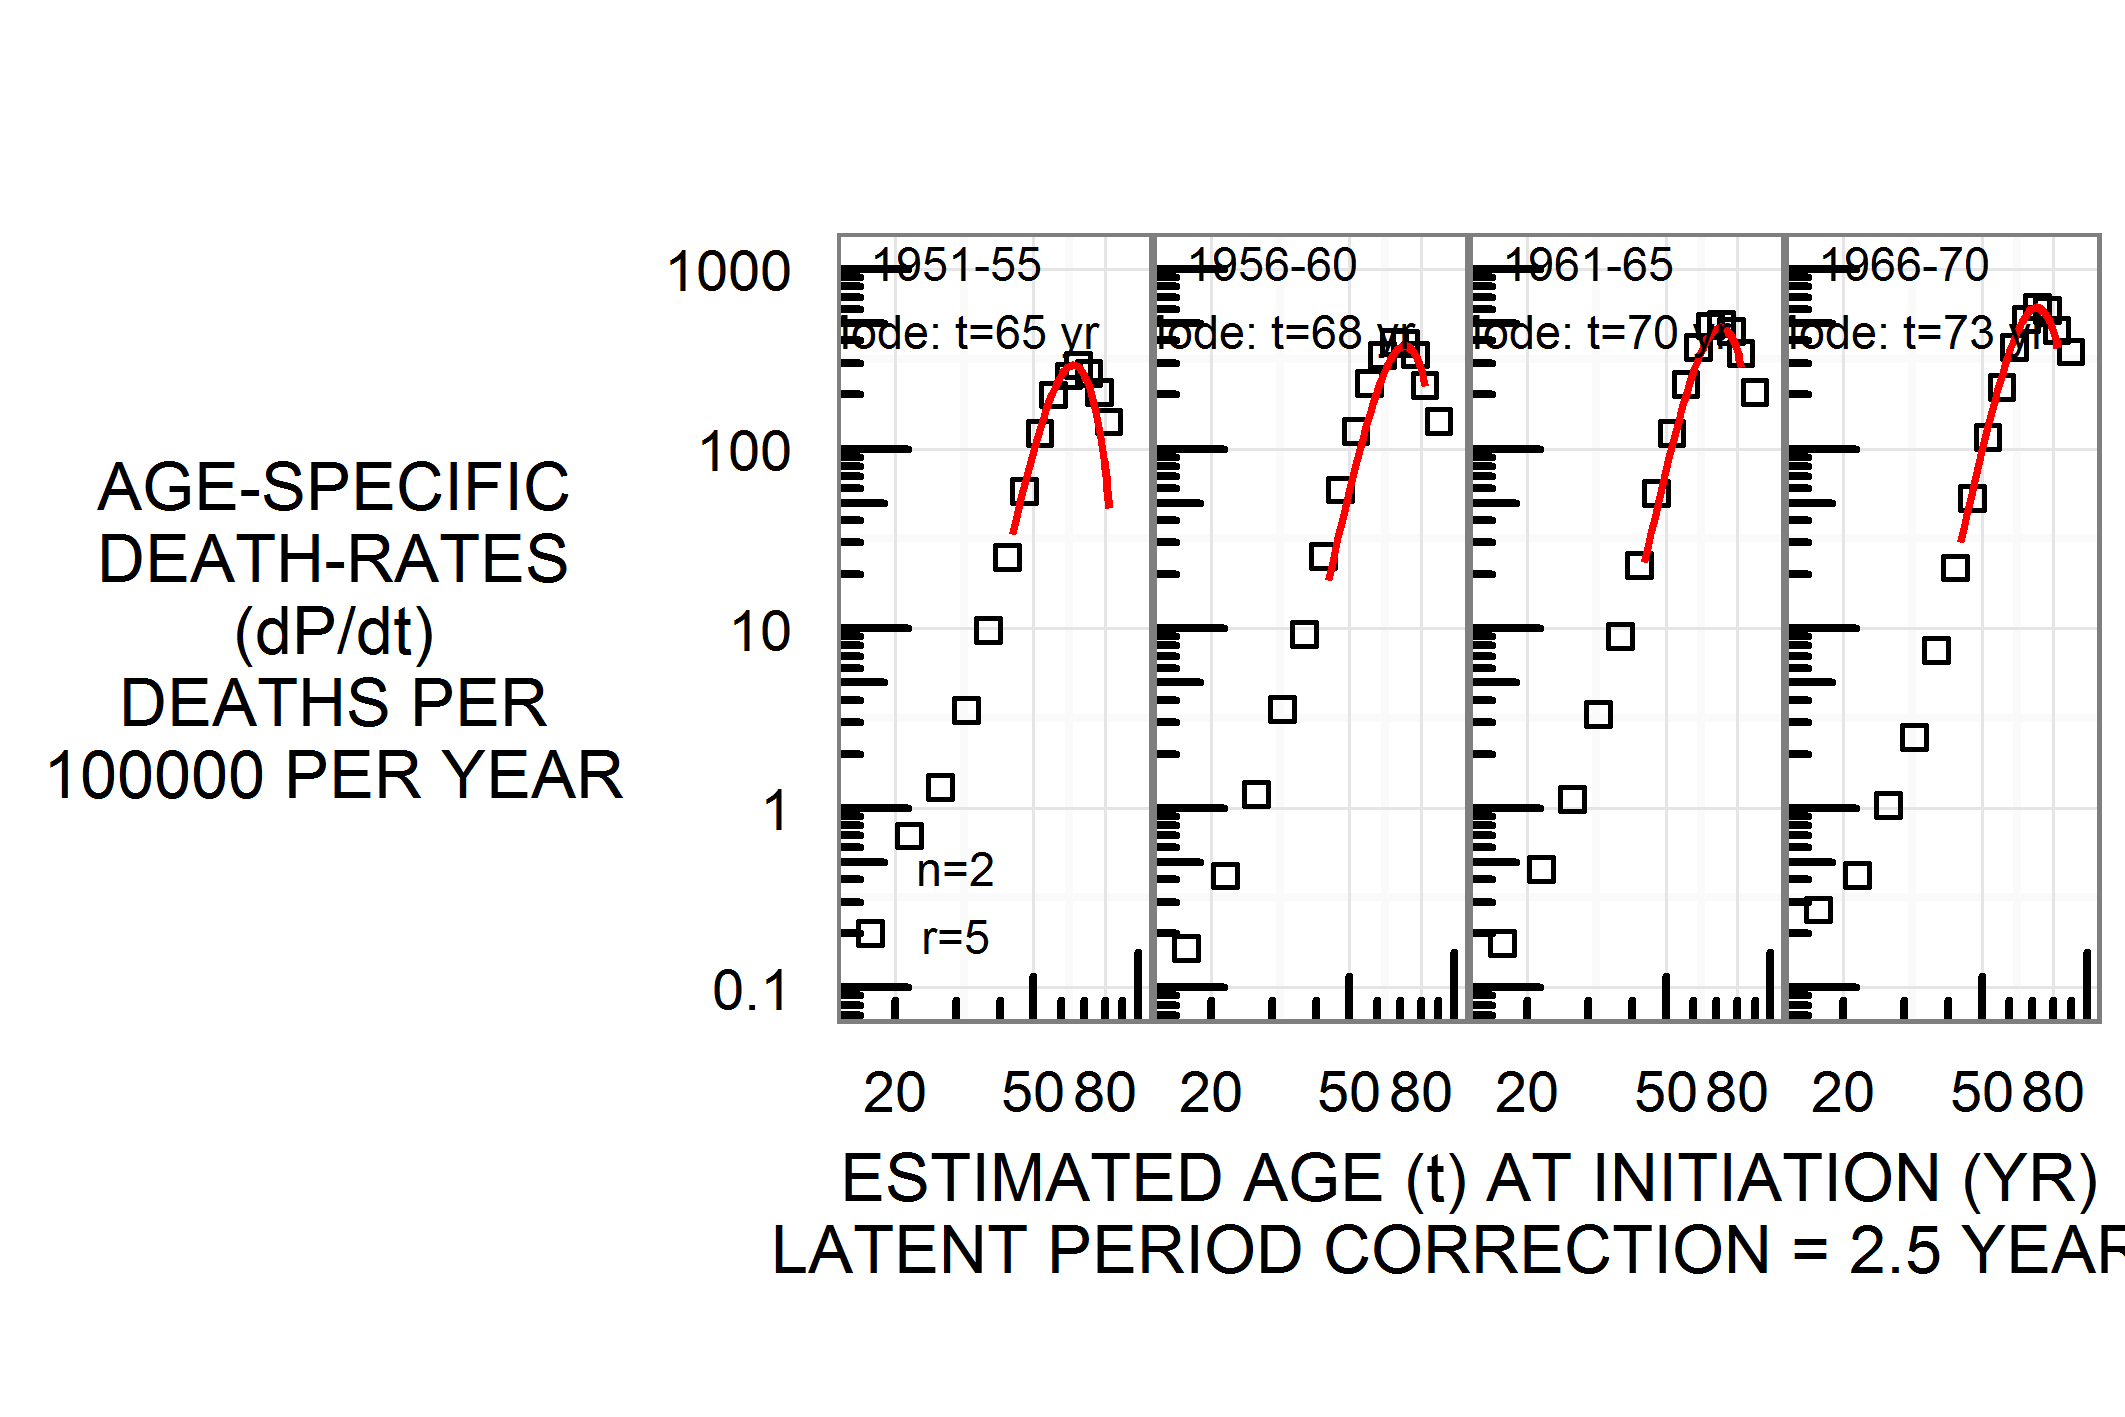
Fig. 2.9: Lung cancer deaths in England and Wales, 1951-1970, male.
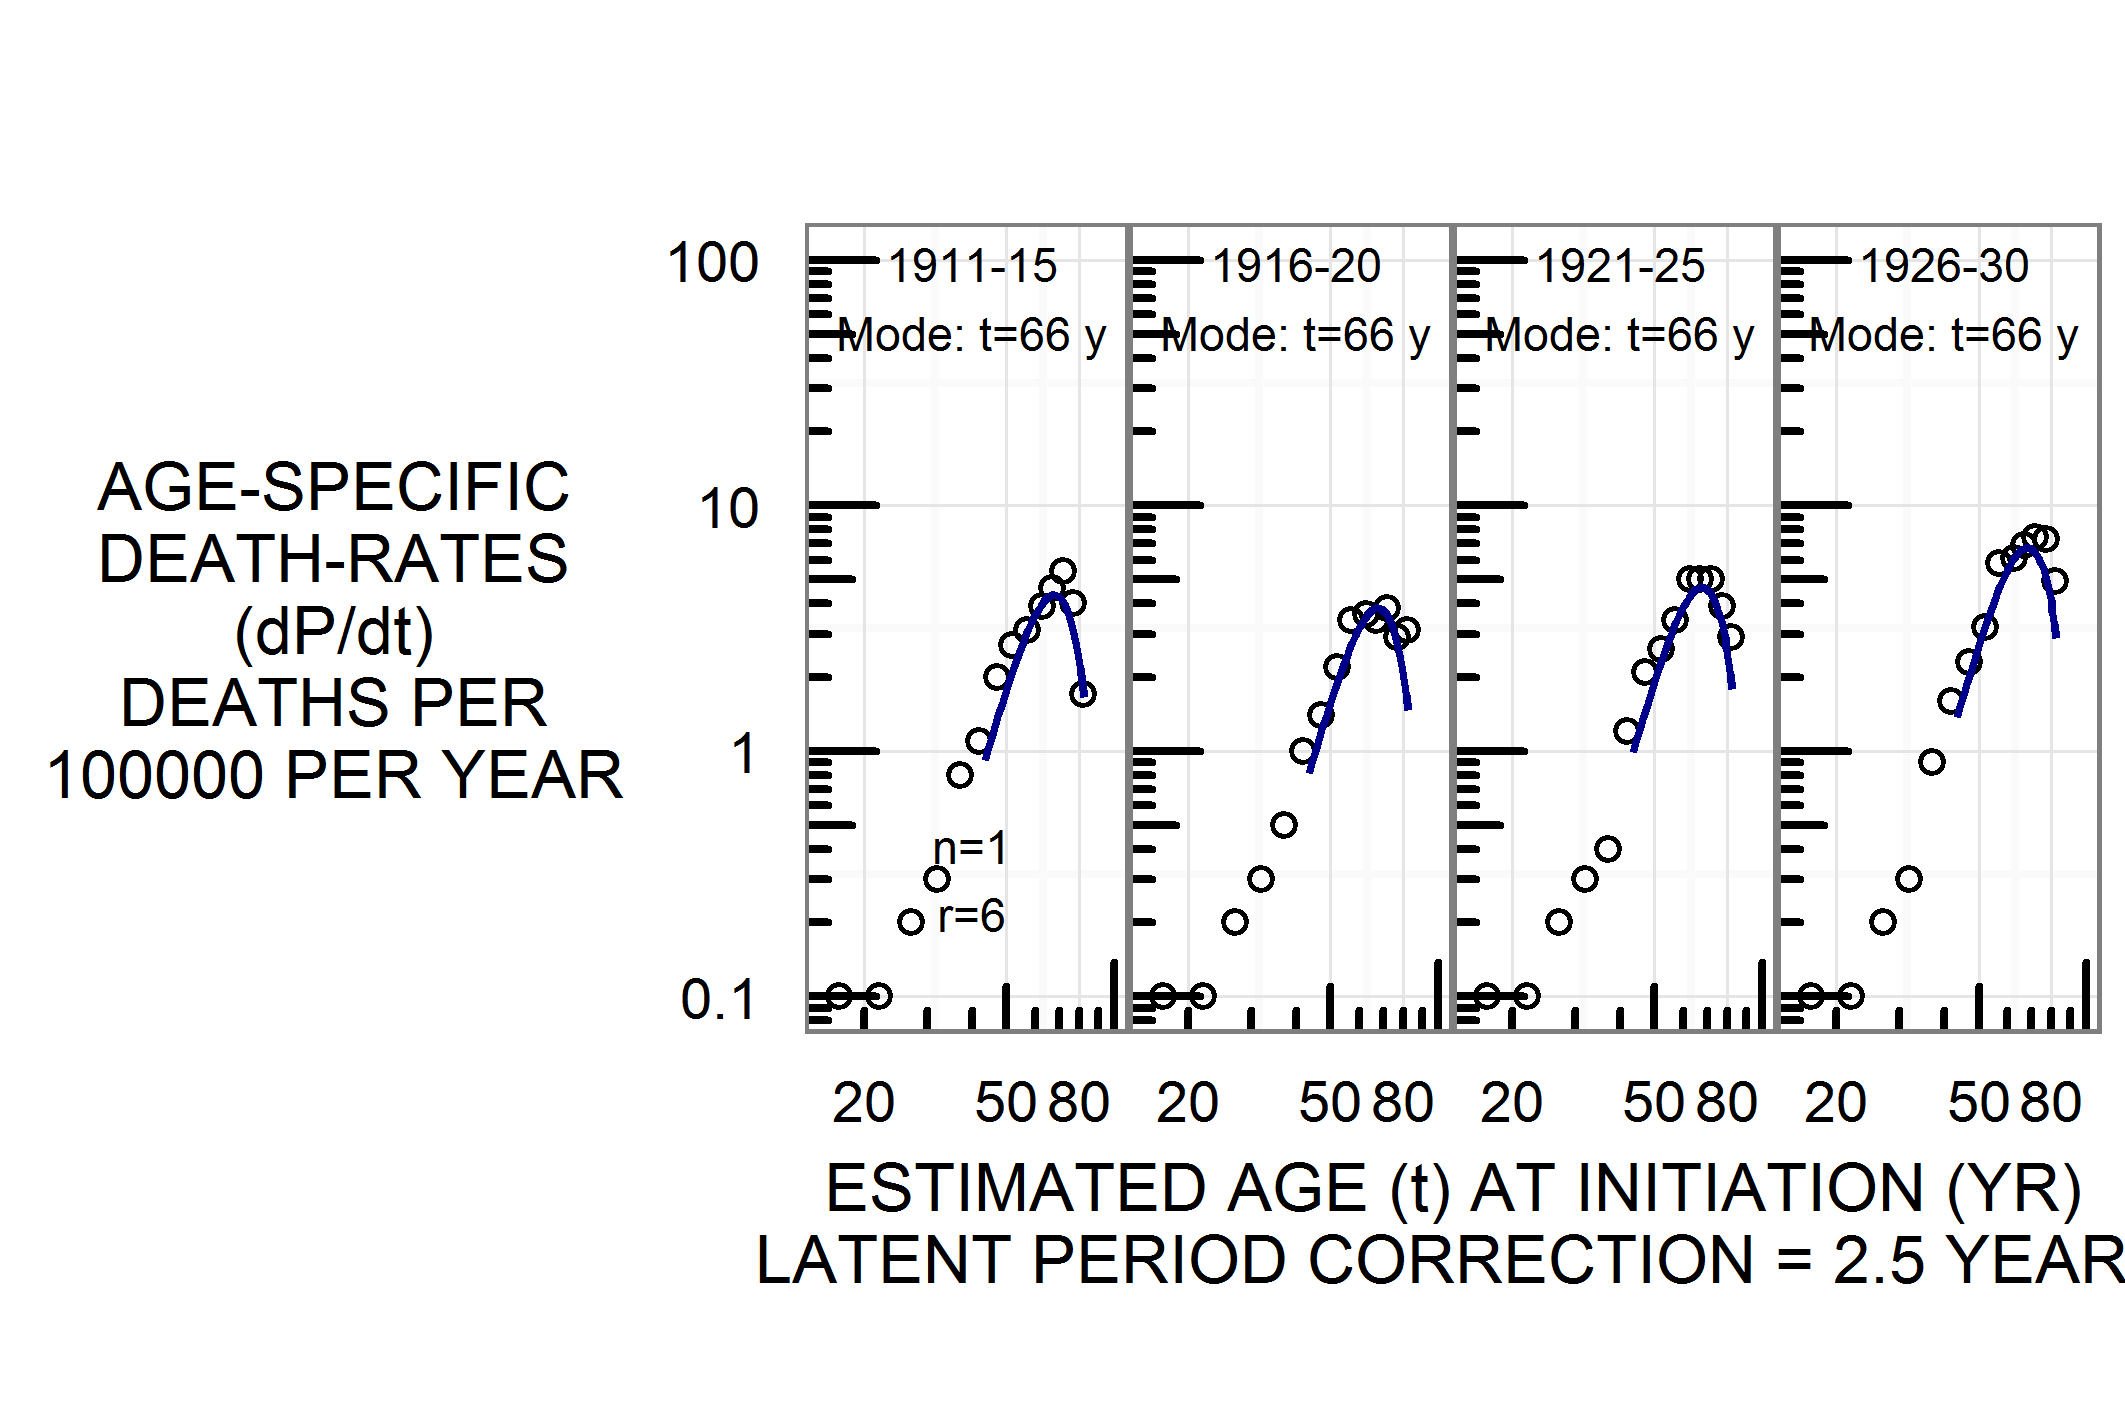
Fig. 2.10: Lung cancer deaths, England and Wales, 1911-30, female.

Fig. 2.11: Lung cancer deaths, England and Wales, 1931-50, female.
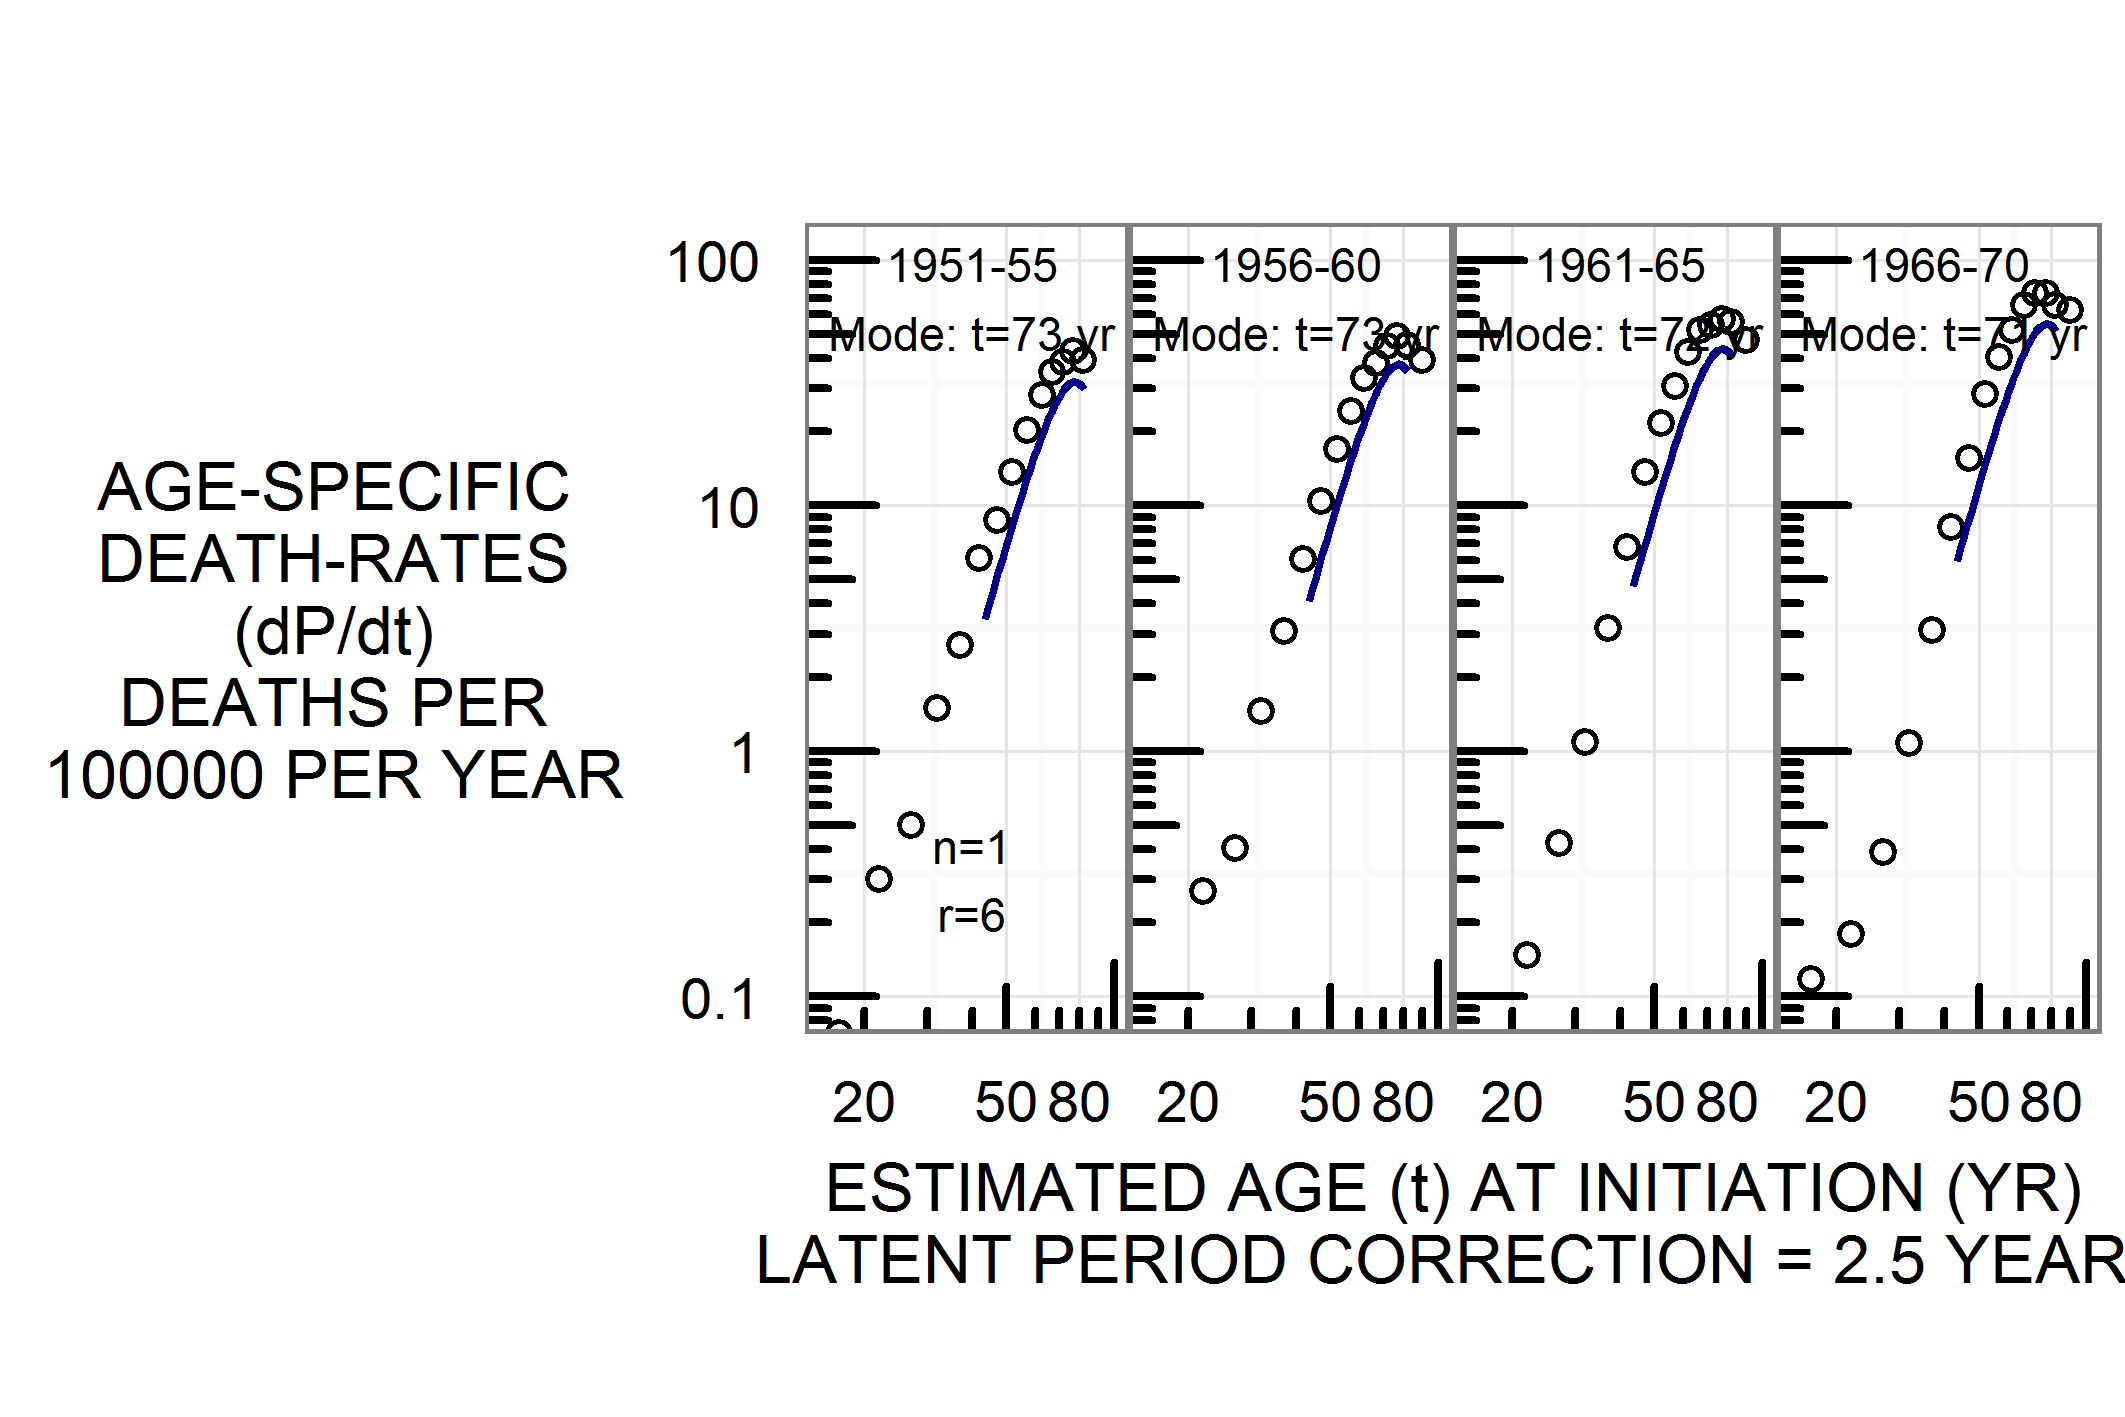
Fig. 2.12: Lung cancer deaths, England and Wales, 1951-70, female.
The Burch Curve: twenty-four countries, full set of diagrams
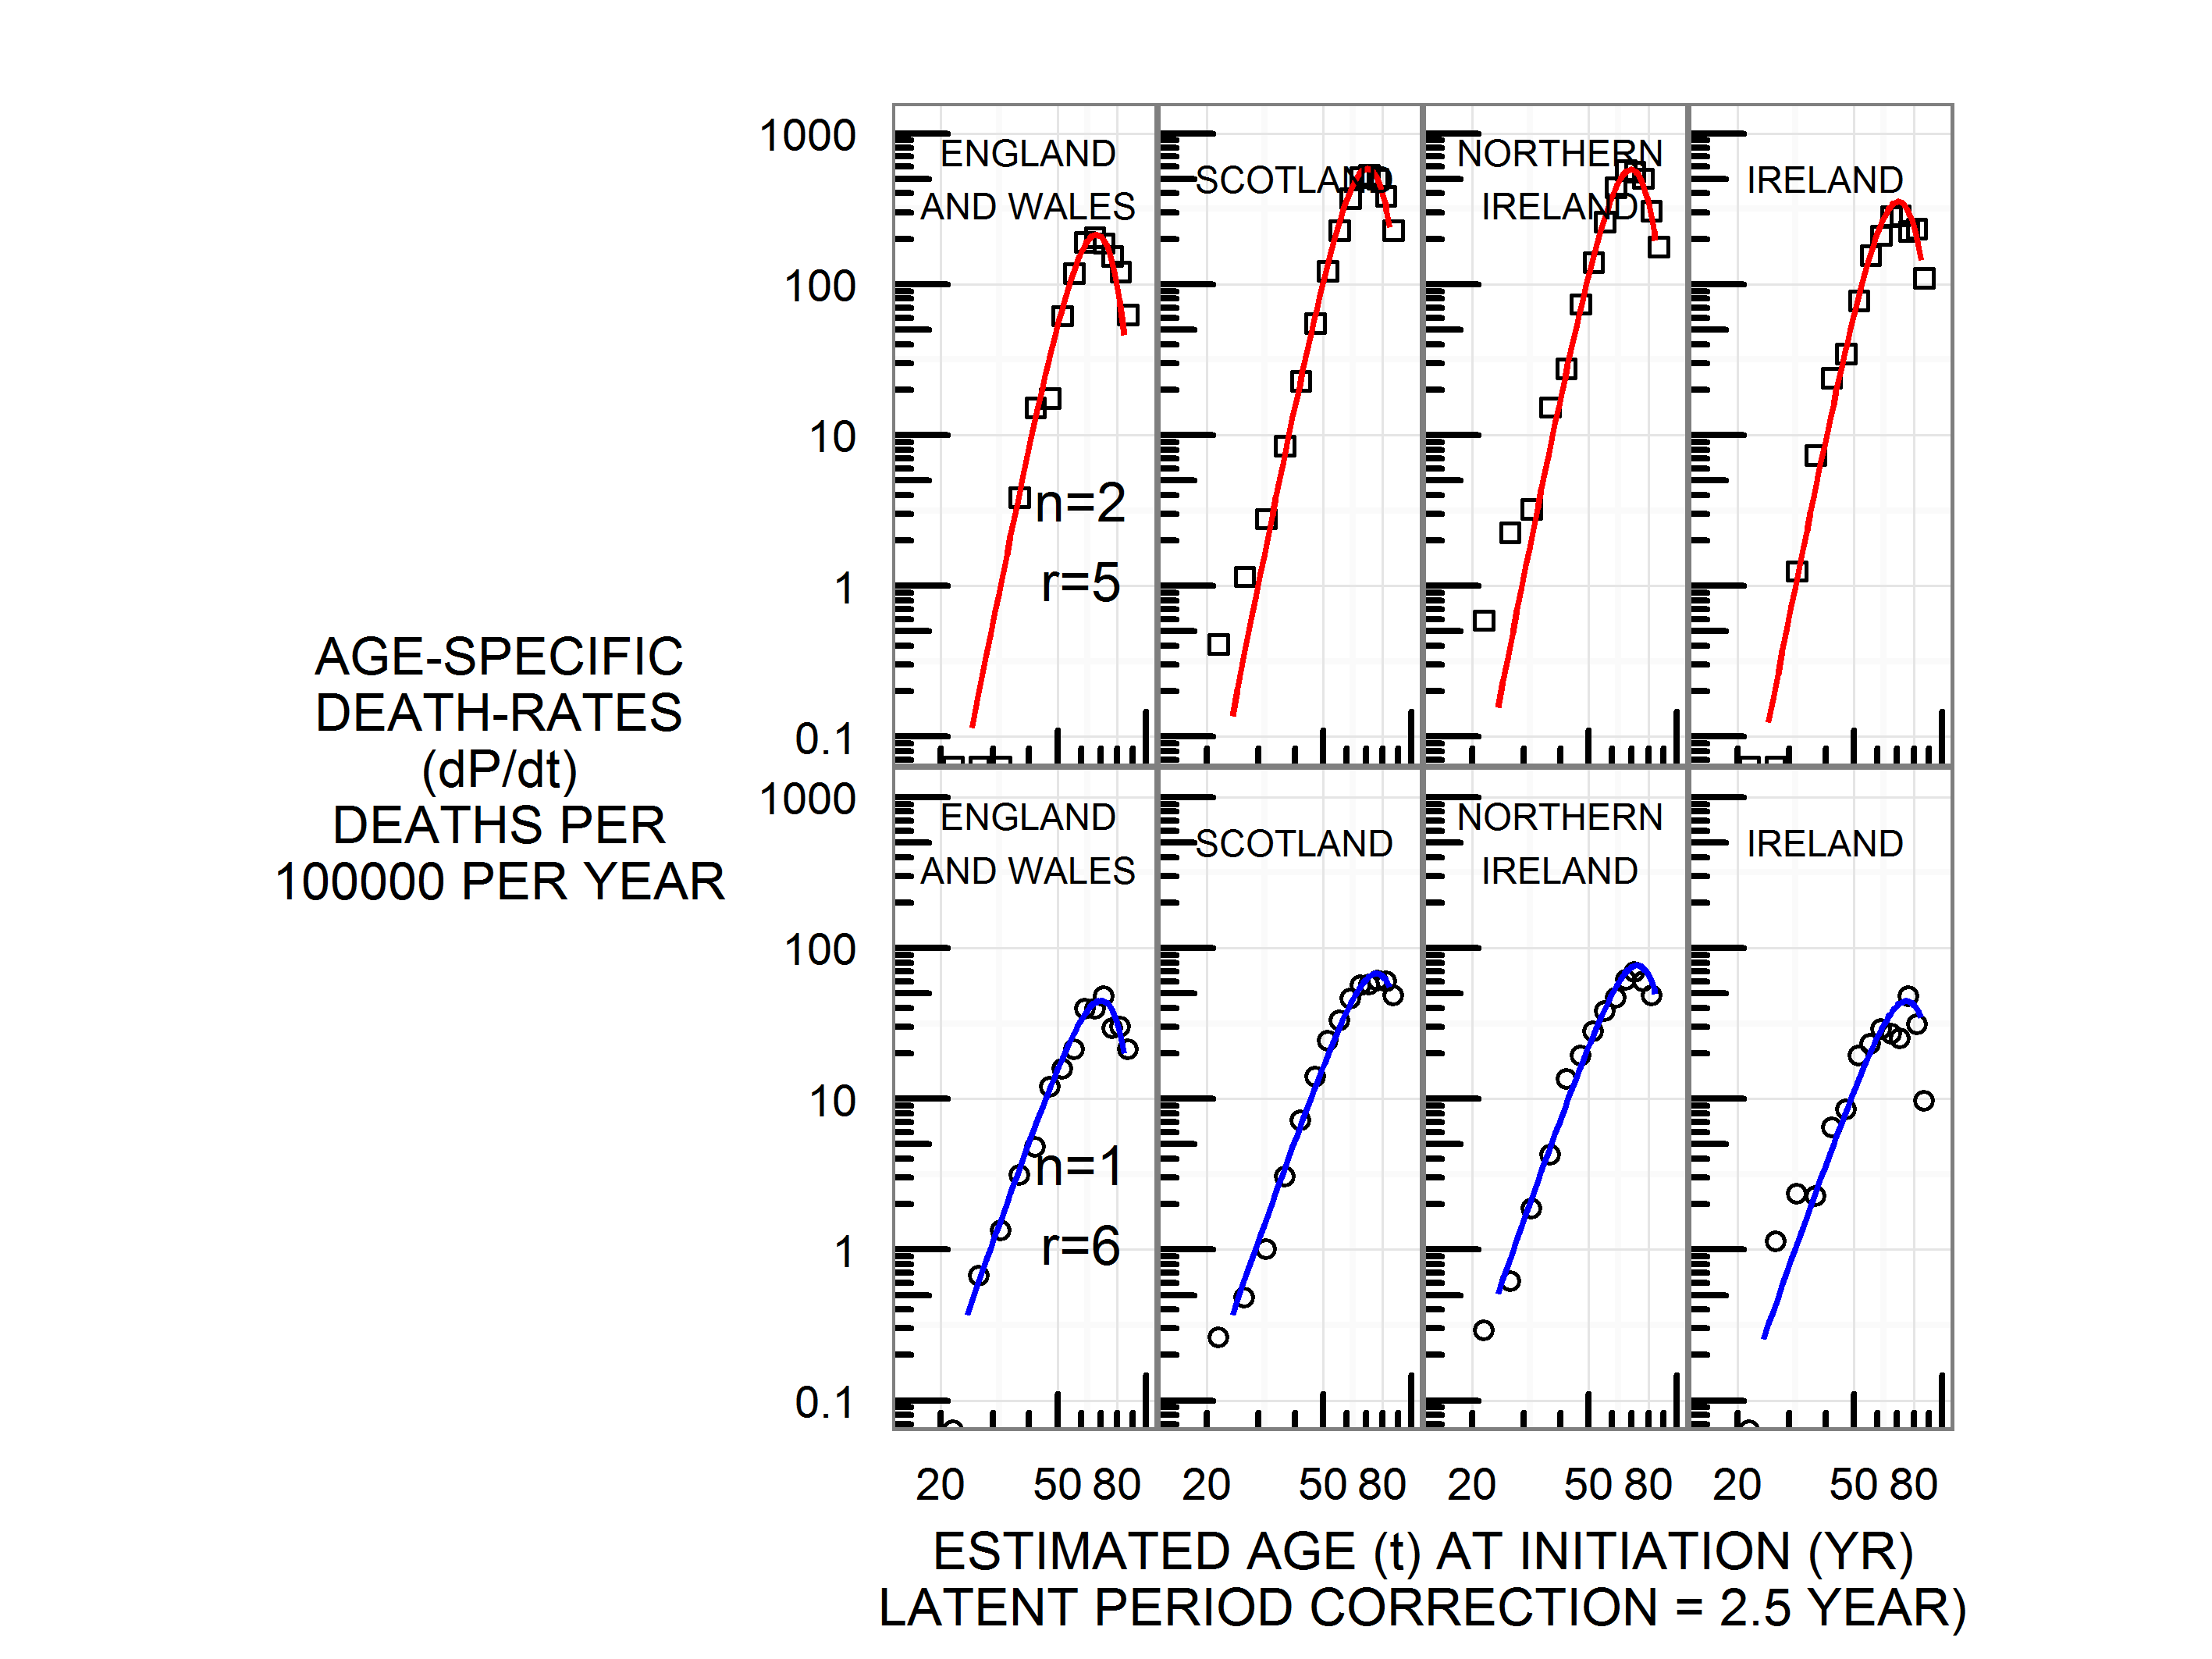
Fig. 2.13: Lung cancer deaths around 1965, England and Wales, Scotland, Norhtern Ireland and Republic of Ireland. Top panel male, bottom panel female.

Fig. 2.14: Lung cancer deaths around 1965, Federal Republic of Germany, Austria, Switzerland. Top panel male, bottom panel female.
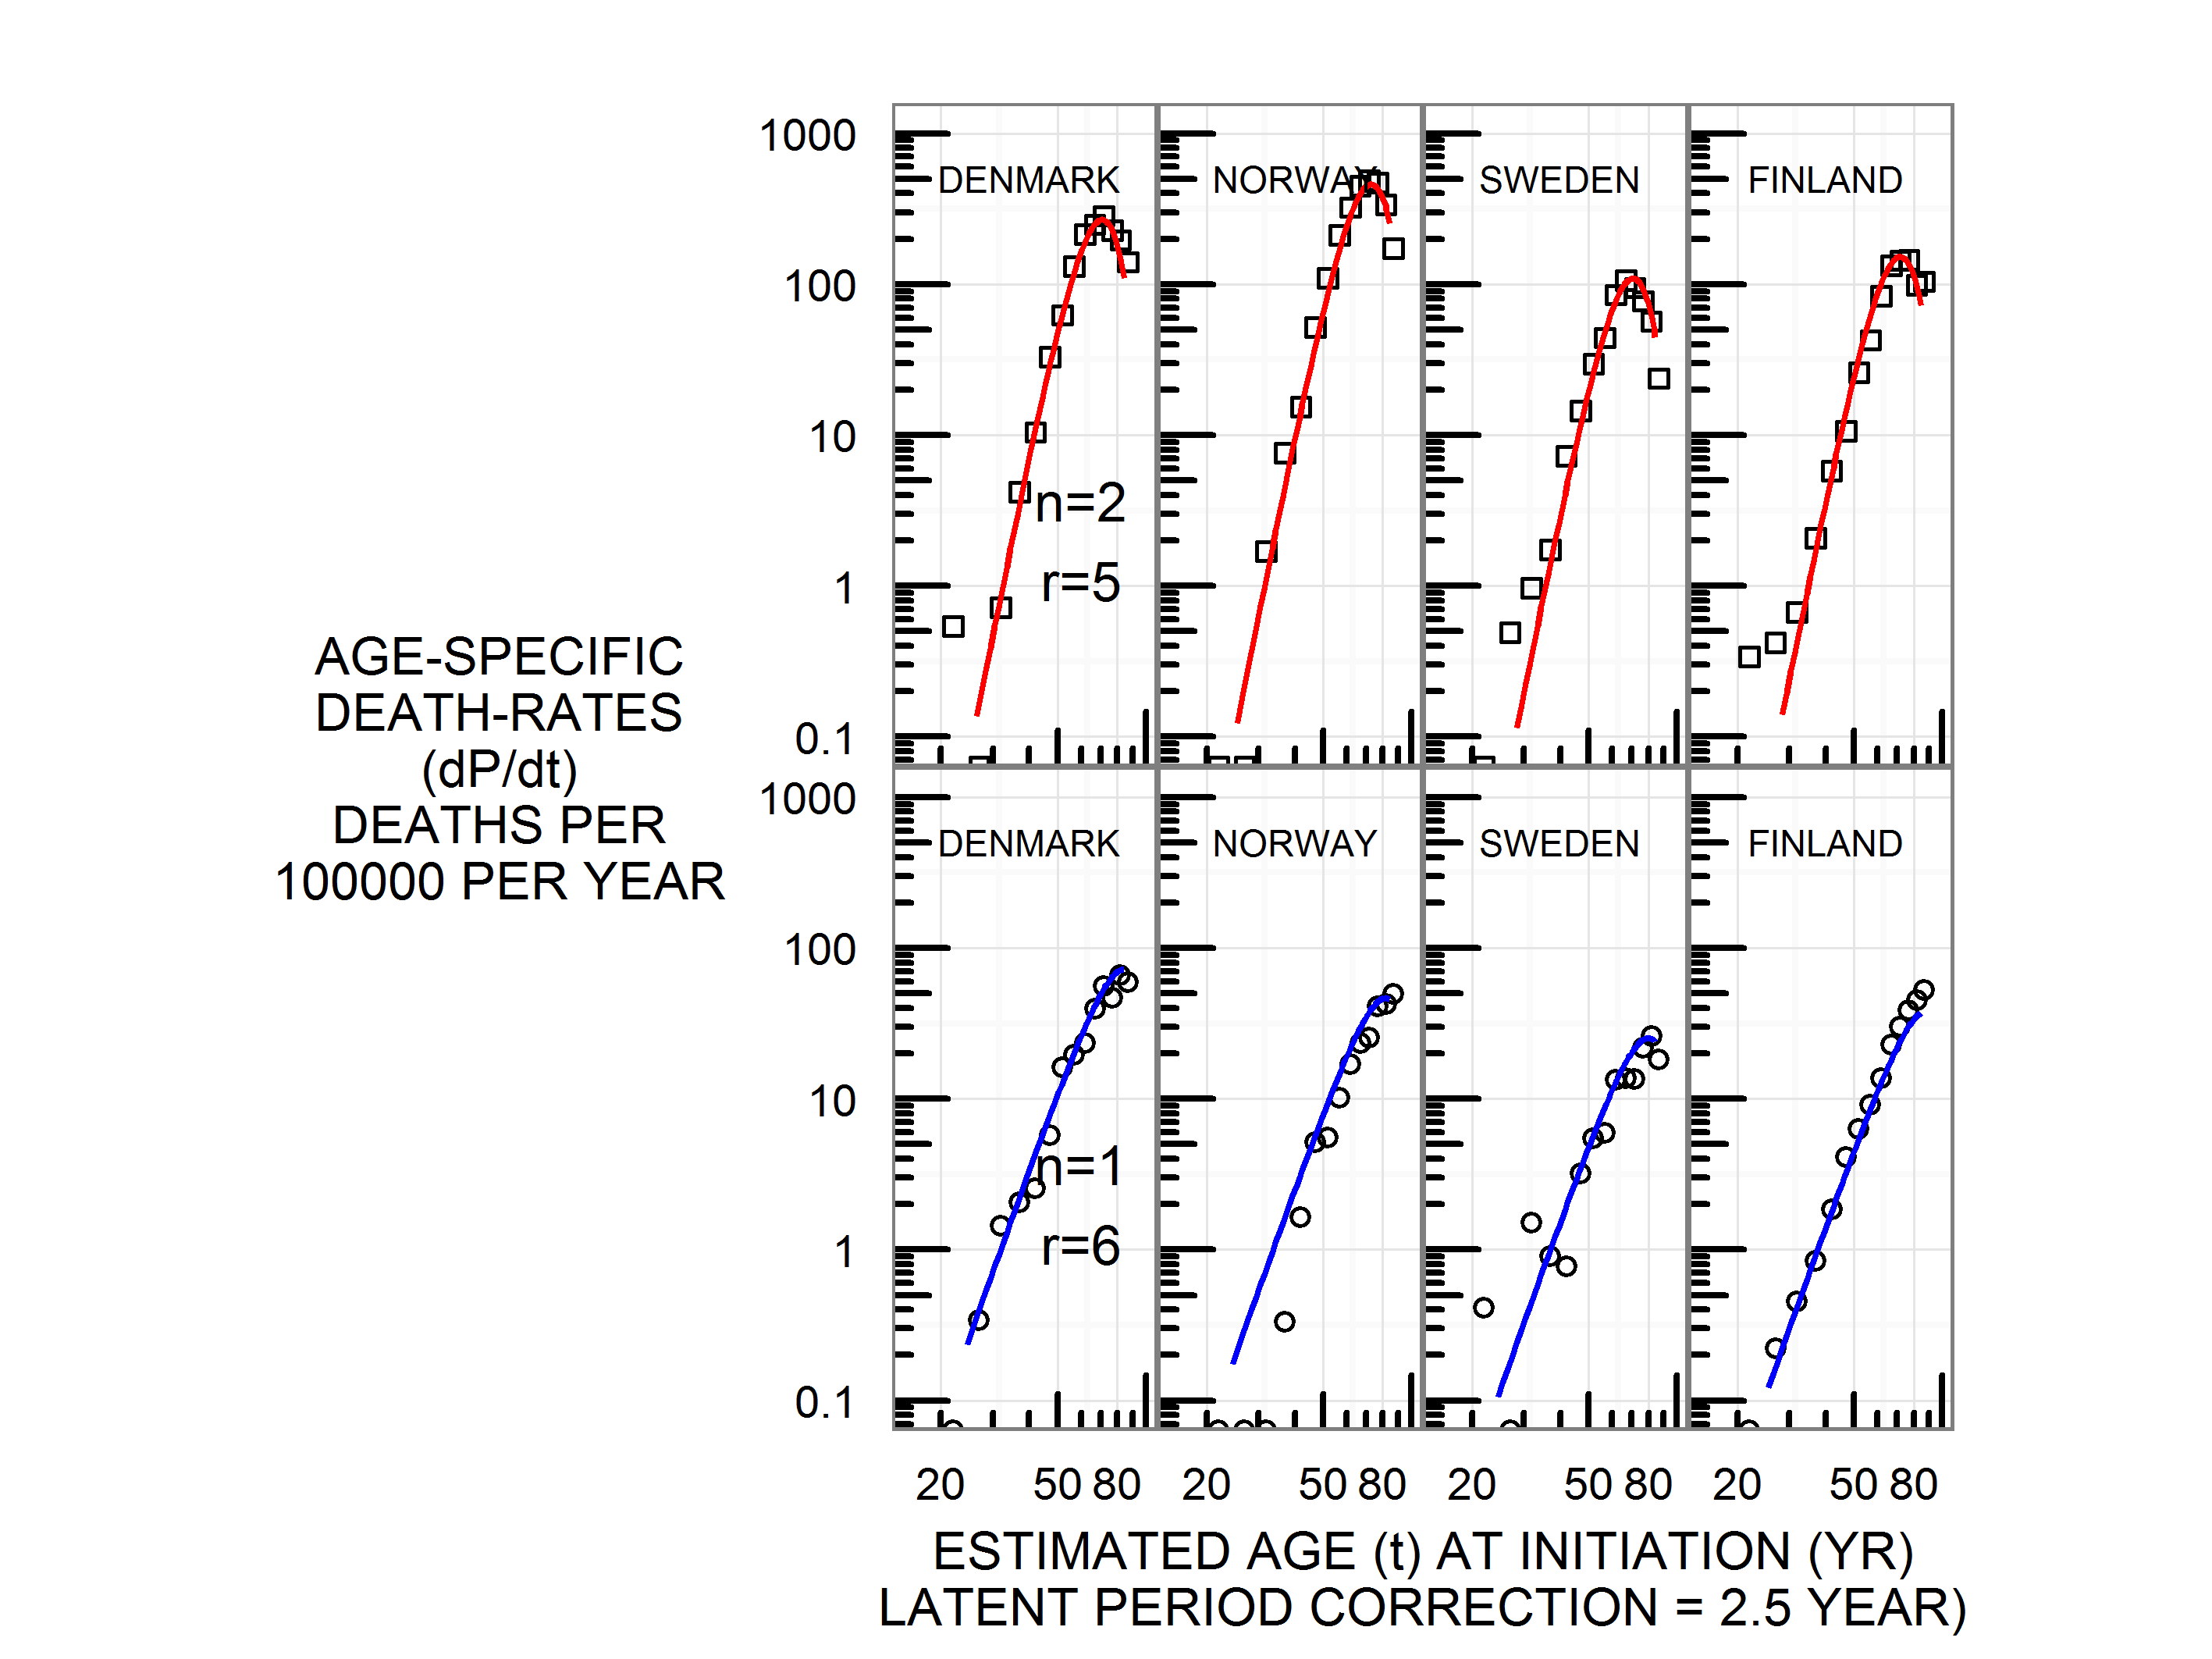
Fig. 2.15: Lung cancer deaths around 1965, Denmark, Norway, Sweden, Finland. Top panel male, bottom panel female.
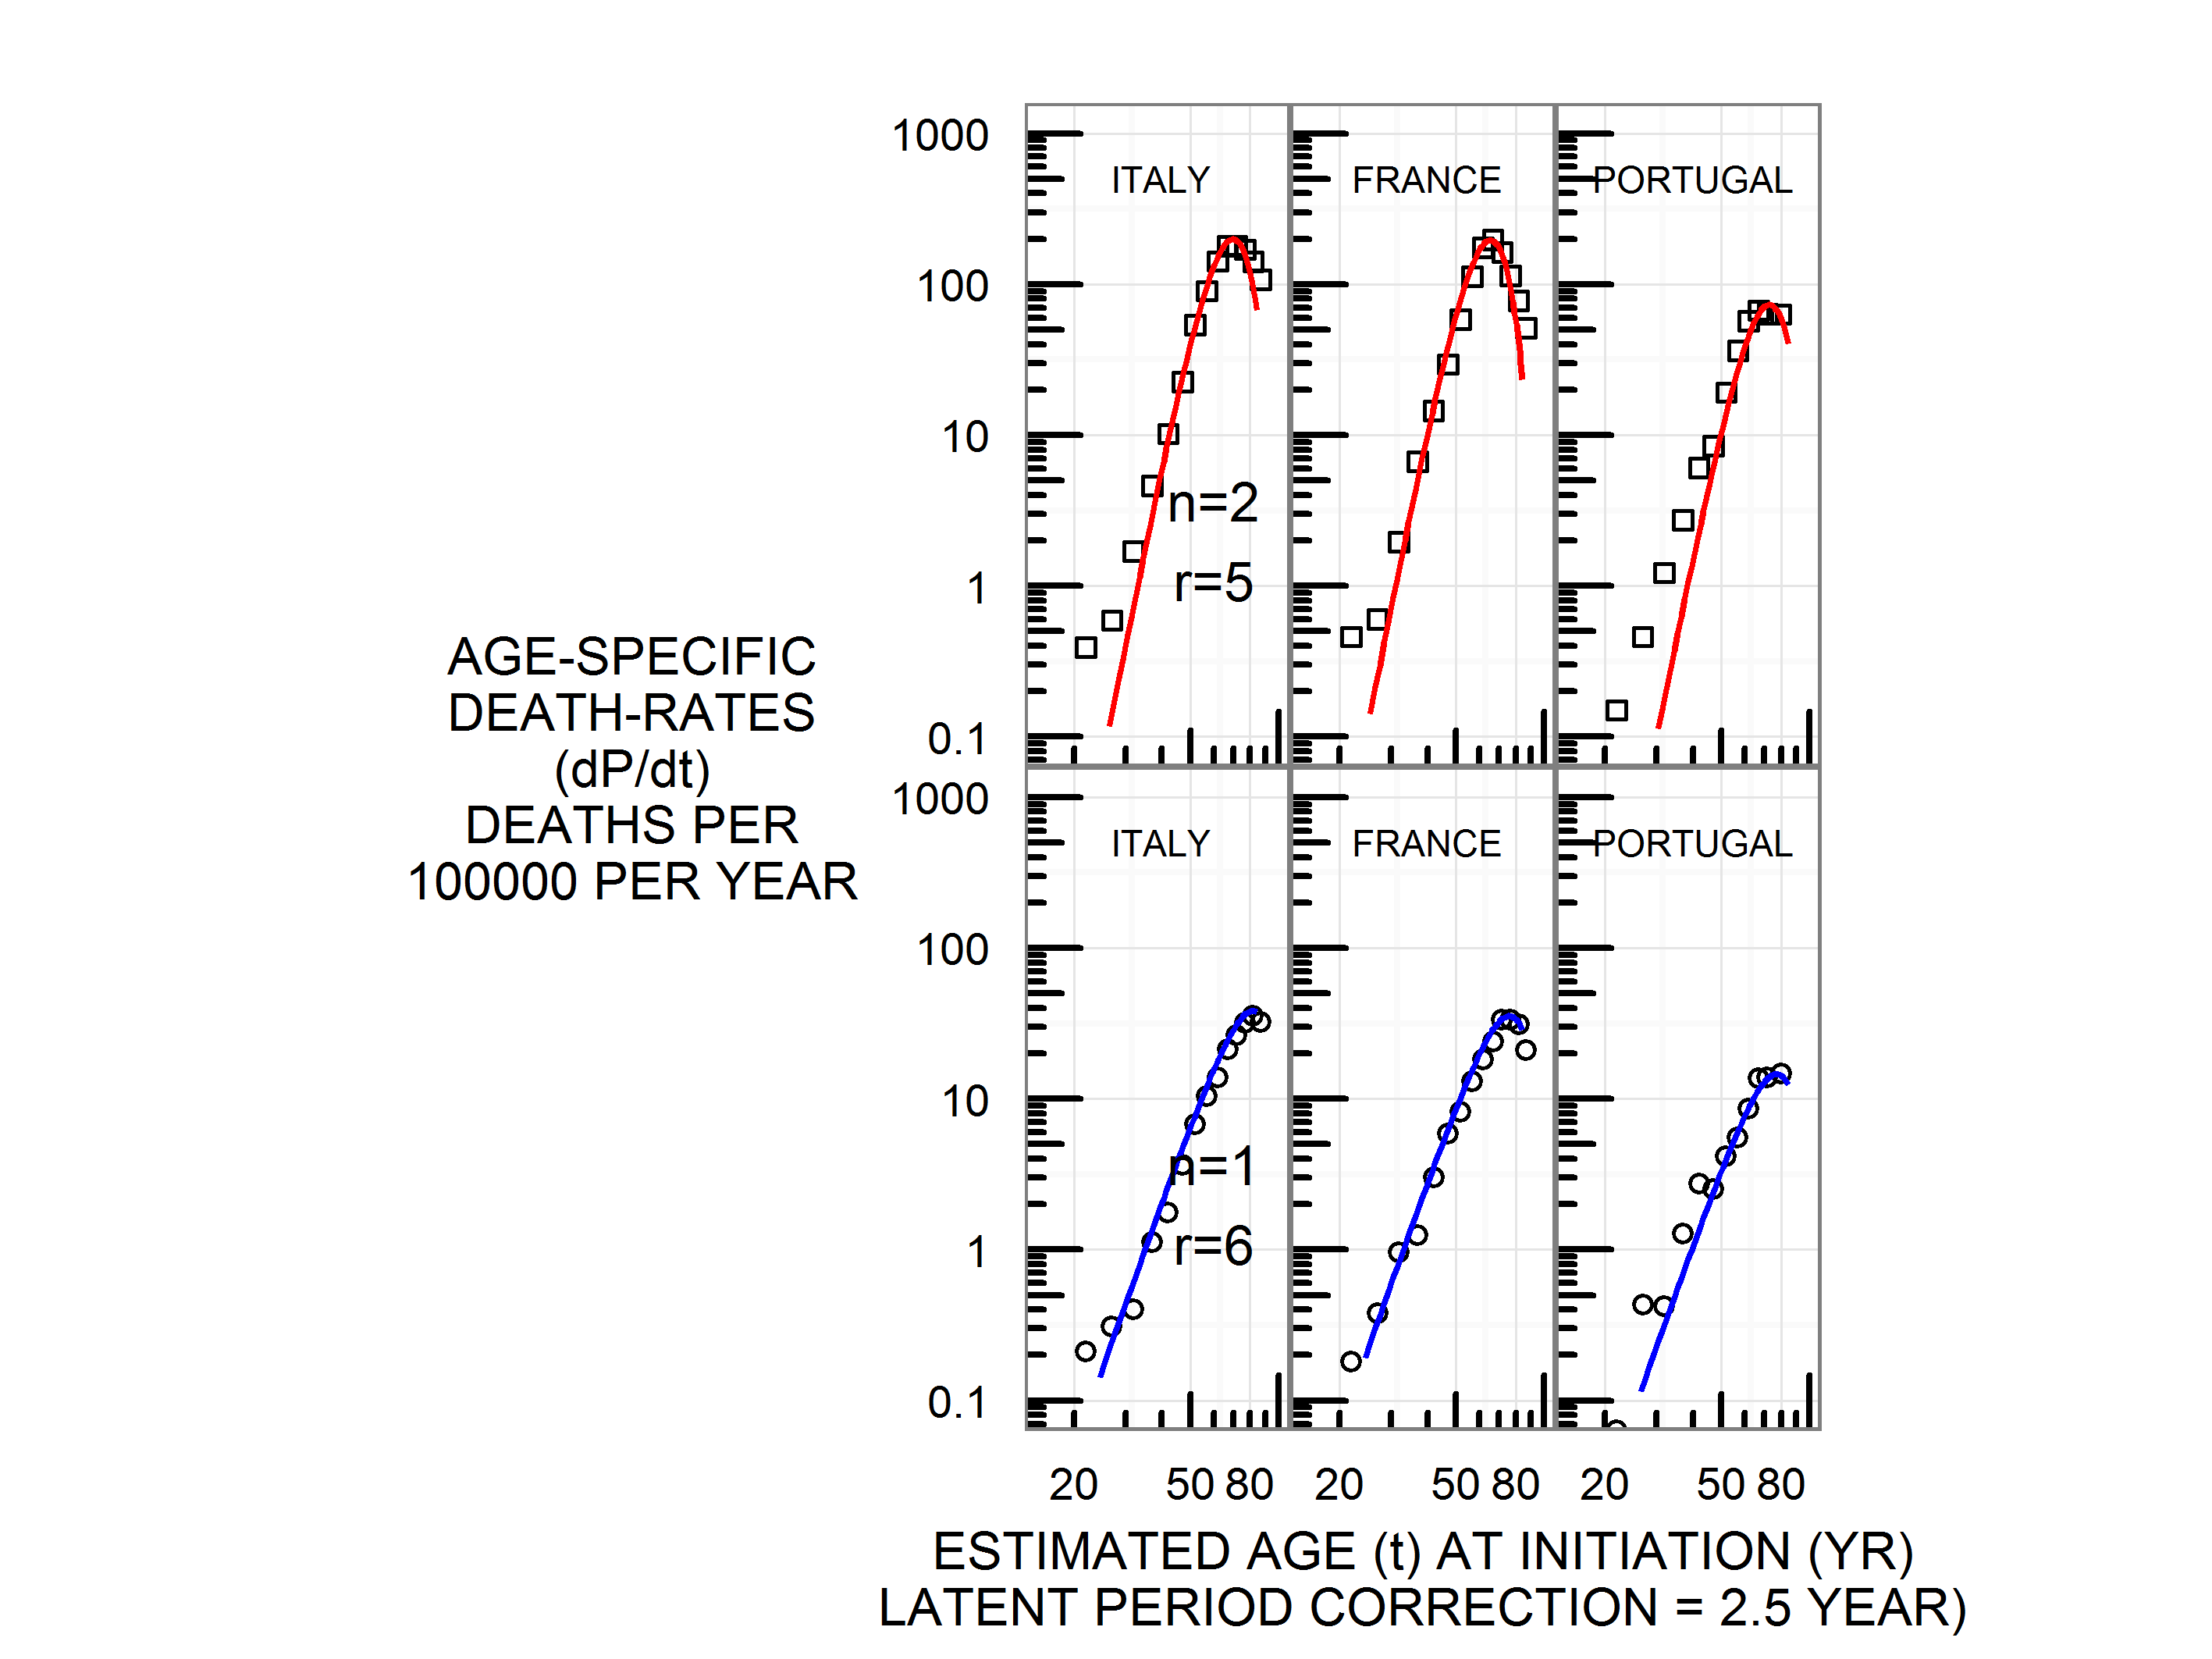
Fig. 2.16: Lung cancer deaths around 1965, Italy, France, Portugal. Top panel male, bottom panel female.

Fig. 2.17: Lung cancer deaths around 1965, Belgium, Netherlands, Australia, New Zealand. Top panel male, bottom panel female.
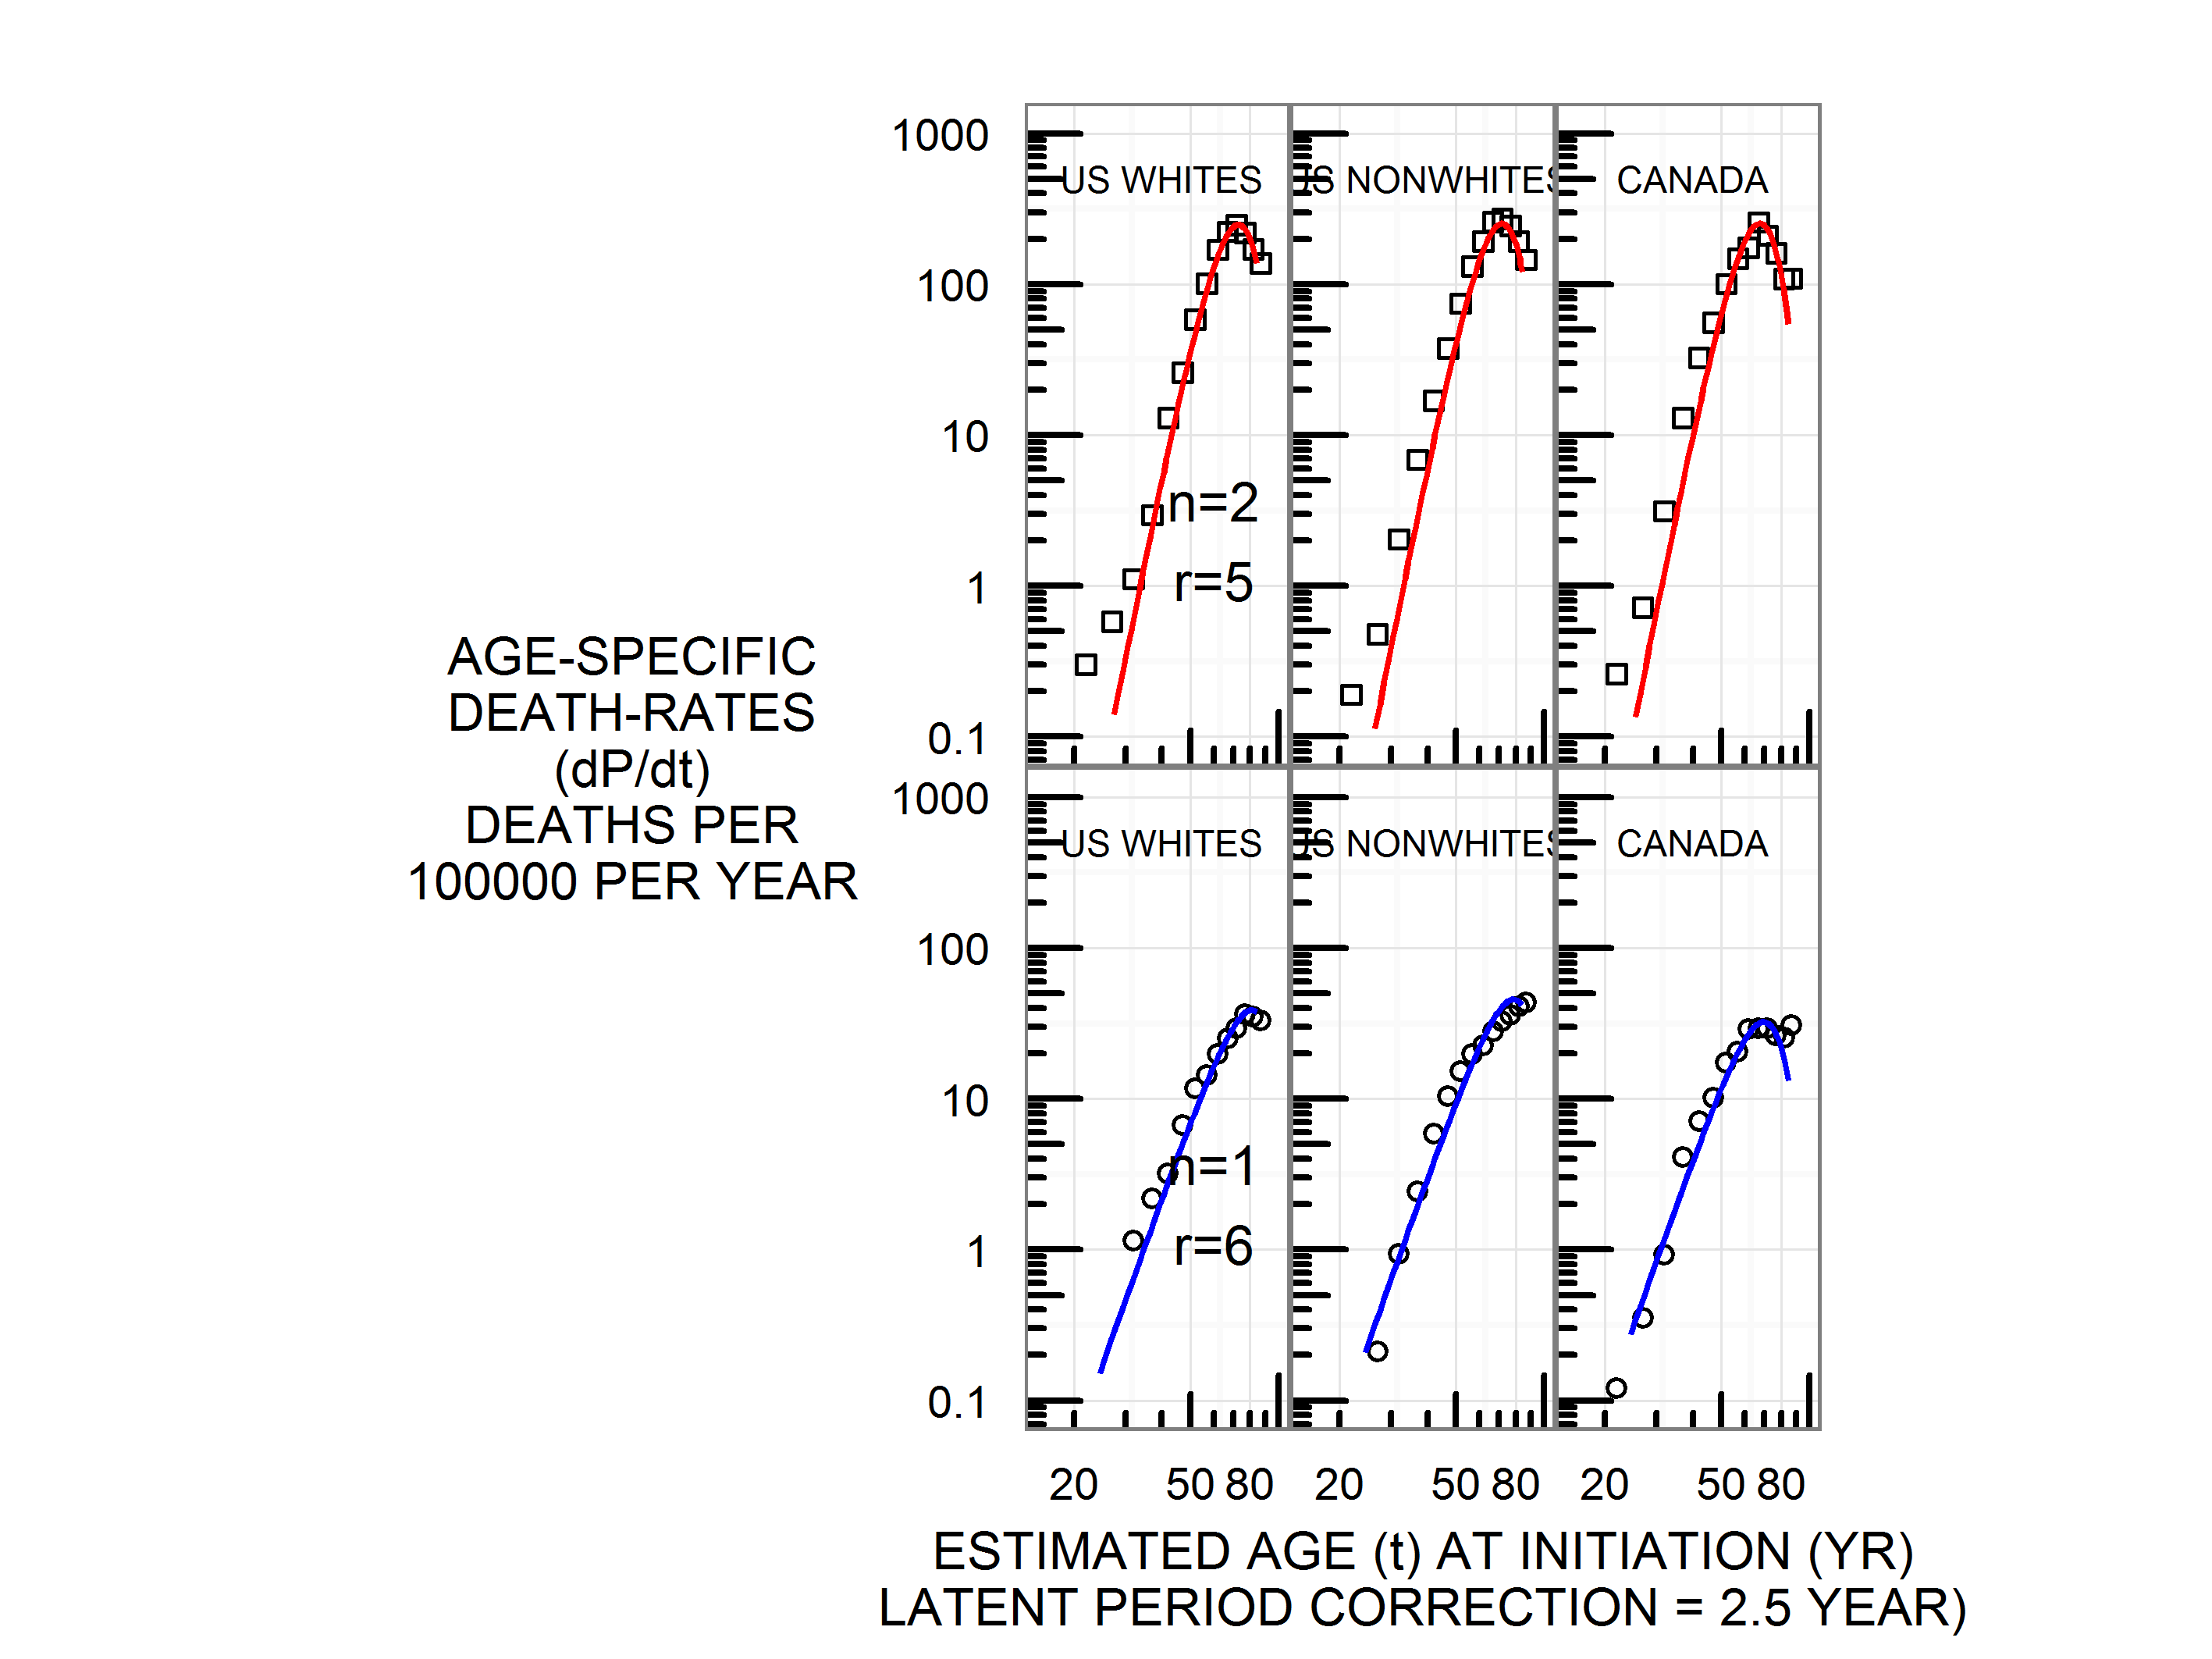
Fig. 2.18: Lung cancer deaths around 1965, United States whites, United States blacks, Canada. Top panel male, bottom panel female.

Fig. 2.19: Lung cancer deaths around 1965, Chile, South Africa, Israel, Japan. Top panel male, bottom panel female.