The Essence of Burch
4. Burch on Doll
Burch’s primary ambition was to explain cancer as a phenomenon, not to refute the claims of Sir Richard Doll about smoking and lung cancer, and none of his papers was written with that aim. (Doll only engaged with Burch on one occasion, in New Scientist in 1974, and in that exchange Burch expounded his views and Doll attempted to refute them, rather than the other way round.) Burch put his case against Doll at some length in the discussion which followed his 1978 lecture to the Royal Statistical Society, supporting his remarks with references to more detailed treatment of each point in his existing publications. This section is based on those remarks and references.
A hail of cigarettes
Since Doll, everybody has known that lung cancer is mainly, though not exclusively, a disease of cigarette smokers. The question is, why this should be so. Doll supposed that the cause of lung cancer in smokers is cigarettes and that the logic of smoking is the logic of the machine gun. One bullet to the body may or may not kill, but a hail of thousands certainly will. Similarly, one cigarette, Doll thought, is near-harmless, but thousands will almost certainly trigger the fatal hits that turn a cell cancerous. It is equally true that the more bullets fly, the more deaths there are, and the more lives are cut short by gunshot wounds. On Doll’s view, as cigarettes became more common, smoking-related deaths ought to strike ever more people and they ought to strike at ever younger ages. His explanation of lung cancer ran into difficulties with the last point, the age at which the disease strikes.
The power of age
Around 1950, a number of scientists observed that the risk of contracting the commonest cancers rose with advancing age in rough proportion to age raised to the power of a number, often four or five (let us say five for brevity). That is to say, at age 20 your risk of cancer is 205 in some unit of measurement and at 60 it is 605. Richard Doll was not the first to notice this, but it was the basis of his general theory of cancer. He held (almost certainly correctly) that cancer develops in a multi-stage process involving five events called hits which progressively damage a tissue cell. After each hit you are so many times nearer to cancer, and actual cancer develops after the fifth hit.
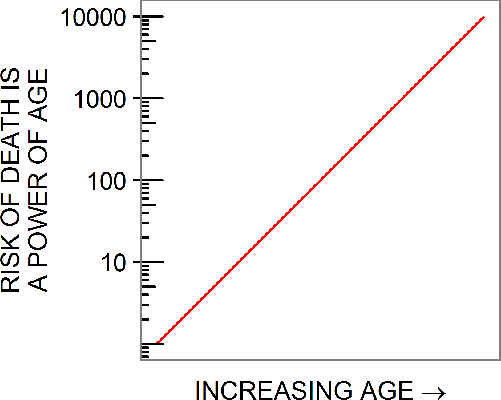
Mathematically, this can be symbolised as
tr
meaning that the probability of cancer at age t is age t to the power of r, where r in this case is 5. This class of expression is called a power law and a graph of it is a straight line when plotted on a logarithmic scale.
Lung cancer in Laputa
If you extend the straight line of a power law onwards indefinitely, the death toll it represents rises into the millions, the billions and the trillions. Death rates cannot rise indefinitely, and a thought-experiment adapted from Jonathan Swift may clarify what really happens.

The Struldbrugs, in A Voyage to Laputa, are endowed with eternal life but not eternal youth. Far from it, for they gradually succumb to every known illness and yet never die. If, somewhere in the world next year, a cluster of babies were born as Struldbrugs, sooner rather than later, by the operation of Doll’s power law, every one of them would have lung cancer.

To vary the thought-experiment slightly, suppose that there arose a cluster of mutant Struldbrugs prone to die from lung cancer but no other disease. As the mutants aged, the power law would produce a rising death rate until the point where more of them were already dead than remained alive and waiting to be picked off. One Arnold Reif, in controversy with Burch, estimated that that point would fall around the age of 210. Thereafter death rates would still rise progressively as a proportion of the mutant population but fall as a proportion of the population as a whole until the pool of mutant Struldbrugs decayed to near-nothing at around 320.
Doll, Burch and Weibull
Mathematically, this pattern in which a power law exhausts a finite population is called exponential decay and involves the exponential function exp() with negative arguments. The expression
1 − exp(−1 · tr)
gives the fraction of the population who are already dead at at time t. (Multiplication by −1 converts the exponential function exp() into exponential decay, and subtraction from 1 gives the number of dead rather than the number still living.)
The expression and curve which Burch fitted to his data on cancer is called a Weibull distribution (after a Swedish mathematician). It is explained more fully in the section Burch on cancer.
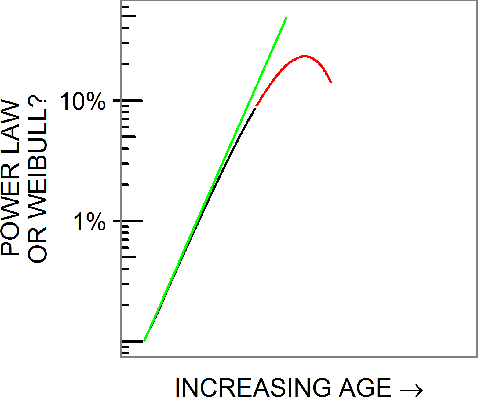
Theoretically, Doll’s curve is also the rising portion of a Weibull. However, Doll did not usually bother with exponential decay at all. He held that if you extended his curve to the biblical age of Methuselah, it would eventually peak and fall, but that over the normal human lifespan no correction to his simple power law was necessary. (This assumption is what the rising and falling Burch curve, fitted to data on seven decades and 24 countries, more or less disproved.)
Pack-years
On the face of it, the risk of lung cancer in smokers seemed to rise in a rough proportion to age raised to the power of six or seven (let us say seven for the sake of brevity).
However, Doll held that the underlying pattern was a fifth power of age as a smoker (years of smoking), further modified by rate of smoking – light, moderate or heavy. This meant that Doll treated lung cancer in smokers as a function, not of age in years t, but of
N (t – w)
where N is number of cigarettes smoked in a day and w is age at starting to smoke. For instance, a 60-year old who has been smoking 30 a day since age 20 is supposed to have a risk of lung cancer related to 30 ∙ (60 – 20).
This amounts to a pack-years theory of lung cancer: rates of lung cancer and the age at which it strikes are supposed to be different in heavy smokers, light smokers, ex-smokers and passive smokers, and the explanation is supposed to be the packs of cigarettes they have behind them, or the years or, more plausibly, a combination of the two.
Doll vs evidence
Data on death rates at old age is crucial to any test of Doll’s theory of carcinogenesis as against Burch’s. Both men predicted very similar proportional rates of lung cancer in mid-life, but Doll predicted that rates should continue to rise into old age and Burch that they would fall. (Centagenarian smokers, often dismissed as a mere curiosity, ought to be vanishingly rare according to Doll.) Doll’s papers often exclude data on the highest age groups. Pointed remarks in Burch’s published work, and franker statements in his private correspondence, indicate that he suspected Doll of suppressing evidence.
Burch tested Doll’s hypothesis against all the empirical data known to him, but three studies are particularly worth mentioning. One is E. Cuyler Hammond’s “million man” investigation for the American Cancer Society, large in scale but poorly designed (the sample was nowhere near random and unrepresentative of the population). The second is Richard Passey’s analysis of lung cancer series from two London hospitals, published in 1962 but relating to data from the years 1948-56. (A series means all the identified cases between two dates: Burch liked series and collected them himself at Leeds General Infirmary). The third is Hirayama’s prospective study of Japanese smokers and non-smokers, the only such large-scale study with data on a mainly non-white population.
Passey and mean age at onset
Statistics has several measures of the average, two of which are the mean and the mode. The mode of the Weibull distribution is the point at which it peaks; that is, the age at which there are most deaths. The mean is its centre of gravity, the age at which exactly half of all deaths have already occurred. The mean of Burch’s Weibull curve, and the one implicit in Doll’s power law, both fall to the left of the mode, that is at a younger age.
Passey made two very interesting observations about the mean age at diagnosis of his sample of lung cancer patients, who were almost all smokers, suggesting that neither cigarette consumption nor years as a smoker affected the mean. The light, moderate and heavy smokers all clustered around a mean age of about 57.3. The smokers who started earliest (at 10 or younger) and those who started latest (at 26 or later) both had a mean age of about 61.
In a paper written with (if not by) Malcolm Pike to counter Passey, Doll argued that the theoretical mean age when lung cancer strikes was far higher than these estimates, and that Passey’s figures were an artefact of deaths from other causes. Possibly so, but (as Burch pointed out) the truncated portion of the Weibull which Doll treated as a power law has its own mean. Paradoxically, this mean should be higher in heavy smokers than in light smokers and non-smokers (because a steeper slope pulls the centre of gravity of a power law to the right).
The more you smoke…
“The more you smoke,” according to a government health warning at one time, “the more you risk your health.” This is certainly true in the sense that all the major studies showed a progressively higher risk of lung cancer in non-smokers, light smokers and heavy smokers. Doll and Hill extracted figures from the Doctors’ study which showed risk of lung cancer rising in a more or less straight line when plotted against cigarettes smoked per day. This plot was made on the arithmetical, not the logarithmic scale. The risk is seemingly added to, not multiplied, by increased smoking and powers do not come into it. A relationship of this kind, if it is causal, is a linear dose-response relationship: 1, 2, 3 packs a day increase your risk by 1, 2, 3 units of measurement.
Actually, matters may not be so simple. Hammond’s data suggested a more complicated pattern when you brought age and sex into it, and Hirayama’s Japanese study showed excess lung cancer in smokers but little further difference between light and heavy smokers. Furthermore, studies of Asian smokers generally showed lower lung cancer rates than in white smokers.
… the more you risk your health
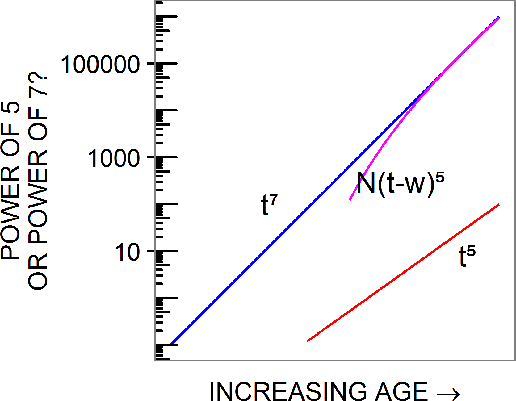
Doll’s pack-years theory of lung cancer in smokers serves to explain how an underlying fifth power of age can appear to be a seventh power. This means that a test of Doll’s predictions against real world data on smokers and non-smokers comes to the same thing as a test of two power laws at work, a power of five and a power of seven.
One prediction of Doll’s model is that there must be some age at which, for every one lung cancer death in non-smokers there are two in smokers, a later age at which there are three, then four, five and so on. The risk rises continually in both groups, but faster in smokers, and the risk ratio between them should get ever larger. A similar divergence should also be seen when heavy smokers are compared with light smokers.
In fact, no steady divergence between lung cancer rates in smokers was apparent in Hammond’s data: there was divergence up to the age of 69 for most categories of smoker (but not all) and then convergence for most categories of smoker (but not the same ones).
One heavy smoker equals two light smokers
Given a dose-response relationship and statistics on consumption of tobacco it should be possible to quantify fairly precisely what effect an increase in smoking rates has on lung cancer rates. The linear dose-response relationship has a property which makes the calculation a simple one: if one pack a day adds x to your risk, then two packs a day add x and x again to it. Another, less obvious way of putting this is that the risk in one two pack a day man is the same as the risk in a pair of one pack a day men (x in one plus x in the other). As Burch put it, one heavy smoker equals two light smokers. That is why his work mostly concerns smoking rates and cancer rates in the general population. The total number of cigarettes is what counts and not the number per smoker.
The missing cigarettes
Given a known increase in cigarette consumption between 1900 and the mid-1950s, what increase in lung cancer should we expect to see? Burch performed the calculation twice, once in The Biology of Cancer (p. 325) and once in Smoking and Lung Cancer: the Problem of Inferring Cause (p. 446-8) using newly available data. The main complication was to allow for the presumed effect of pipe and cigar smoking. The result?
In 1958 the average British male equalled roughly half of a cigarette smoker, one third of a non-smoker or ex-smoker and one fifth of a smoker of other types. He had a lung cancer risk 8.3 times in excess of a non-smoker. His counterpart in 1900 had smoked pipes or cigars if at all, and had 4.5 times the risk of lung cancer of a non-smoker. If you multiply the average male by the actual number of males, you should see 83 cases of lung cancer in 1958 for every 45 in 1900.
In other words, cigarette smoking should more or less have doubled the lung cancer rate. It could not possibly have raised it 100-fold as Doll and Hill claimed.
Armitage on the dose-response relationship
If there were difficulties about the power law and the dose-response relationship considered separately, there was a bigger one about how they combined to explain what Doll wanted them to. The problem was first pointed out by Peter Armitage, who collaborated with Doll on their version of the hit theory. A carcinogenic mechanism involving five hits of a given probability
d · d · d · d · d (= d5)
translated into a power law age distribution. Smoking was supposed to increase the probability that an individual would sustain one or more hits, say the first and the last
c · d · d · d · d · c · d (= c2d5).
where c is the level of smoking. In the above expression the amount of smoking is c and the result is a risk raised by c squared. In the simplest case, 1, 2 or 3 packs a day increase the risk of lung cancer by 1, 4 or 9 units of risk: it is that kind of relationship. The dose-response relationship would only be linear if a single hit was involved. If, as in this example, two hits are involved the relationship would be quadratic. But a two-hit model was implicit in Doll’s claims that smoking produced cancer with a delay of about thirty years and that giving up smoking immediately reduced or froze the risk of contracting lung cancer.
The same point can be made in another way by considering Doll’s expression N(t – w), years as a smoker multiplied by cigarettes per day. The subtraction of w is largely irrelevant, as age in years and age as a smoker are of the same order of magnitude. The essential point is that multiplication by N raises t by two orders of magnitude, from t5 to t7. Since t7 = t5 ∙ t2, multiplication by N is roughly equivalent to multiplication by t2, and if the extra risk is really a function of N rather than t, it has to be a function of N2.
The doctor’s trilemma
Doll had made three claims about the way in which smoking caused lung cancer, namely
a) that smoking affects the first stage of a 30 year multi-stage process,
b) that smoking affects a final stage in the process which ex-smokers escape, and
c) that the dose-response relationship is linear.
These claims were inconsistent and Doll needed to drop at least one of them.
His first thoughts were to split the difference between a) and b). In response to Armitage, he suggested that smoking affects an intermediate stage in the process of cancer induction, an explanation which he admitted was “rather unsatisfactory”.
His second thoughts were to seek evidence of a quadratic dose-response relationship. In a paper written with (if not by) Richard Peto, he claimed to find one in data drawn from his study of British doctors. The data relates to 539 male doctors and fits a quadratic curve, within 90% confidence limits, if one of the data points is removed. It equally fits a linear dose-response relationship within the same confidence limits. On the strength of that paper, he declared the problem disposed of.
Third thoughts followed in the 1980s. Compared with the linear dose-response relationship, the quadratic one predicts higher rates of lung cancer in heavier smokers and lower in light smokers. But the same reasoning predicts a negligible increased risk of lung cancer from the very low doses to which passive smokers are exposed. This was the last thing Doll wanted to prove, and the quadratic dose-response relationship was quietly dropped. Nothing replaced it because by this time there was no need. The new curve had served its purpose and the debate had moved on.
Burch and Doll: the maths compared
Doll and Burch both supplied expressions giving a mathematical answer to the question “Given a population of a fixed size (say 1 million), how many will be dead of lung cancer by a given age (say 65)?” The answer will be 1 million multiplied by a number lying between 0 and 1. The two formulas are attempts to supply that number.
Doll: 1 – exp(-1 ∙ k ∙ N ∙ (t – w)r )
Burch: S ∙ (1 – exp(-1 ∙ k ∙ tr )n
(I write Doll’s formula with k, t, r for ease of comparison: Doll actually wrote ρ, x, k or b, x, k.)
Both expressions are the mathematical representation of a biological model involving random events (a hail of cigarettes or the development of forbidden clones). Both expressions are Weibulls in their cumulative form (CDF). Both look much like power laws up to about age 50. Both make predictions which can be tested against evidence.
Doll’s biological model assumed that cancer originates in a single mutant cell, and that the entire population is susceptible to lung cancer. He therefore had no need of Burch’s parameters n (number of mutant cells) and S (proportion of susceptibles in the population): they would both be equal to 1 and could be omitted. The constant k, common to both Burch and Doll, represents the speed at which biological processes take place. Doll’s parameter N, rate of smoking, increases k, thereby speeding up biology: that is what makes his model of lung cancer a Promoter hypothesis.
Since Doll held that exponential decay did not significantly affect his data
a test of exp(-1 ∙ k (N (t – w)r)) came to the same thing as a test of -1 ∙ k (N (t – w)r
and since he held that lung cancer rates in smokers look like a seventh power but are really a modified fifth power
a test of k (N (t – w)5 came to the same thing as a test of k N t7.