The Essence of Burch
1. Burch on cancer
Health with a half-life
Burch’s theory of the causes of cancer grew from his earlier work on autoimmune conditions. One explanation of these diseases (others exist) is that mutant cells of the immune system go into overdrive and attack the organs they normally defend. In the simplest case, a single immune cell undergoes a single mutation and its descendants (called a ‘forbidden clone’) go rogue. Burch, with his physicist’s eye, saw that this scenario is mathematically equivalent to radioactive decay.
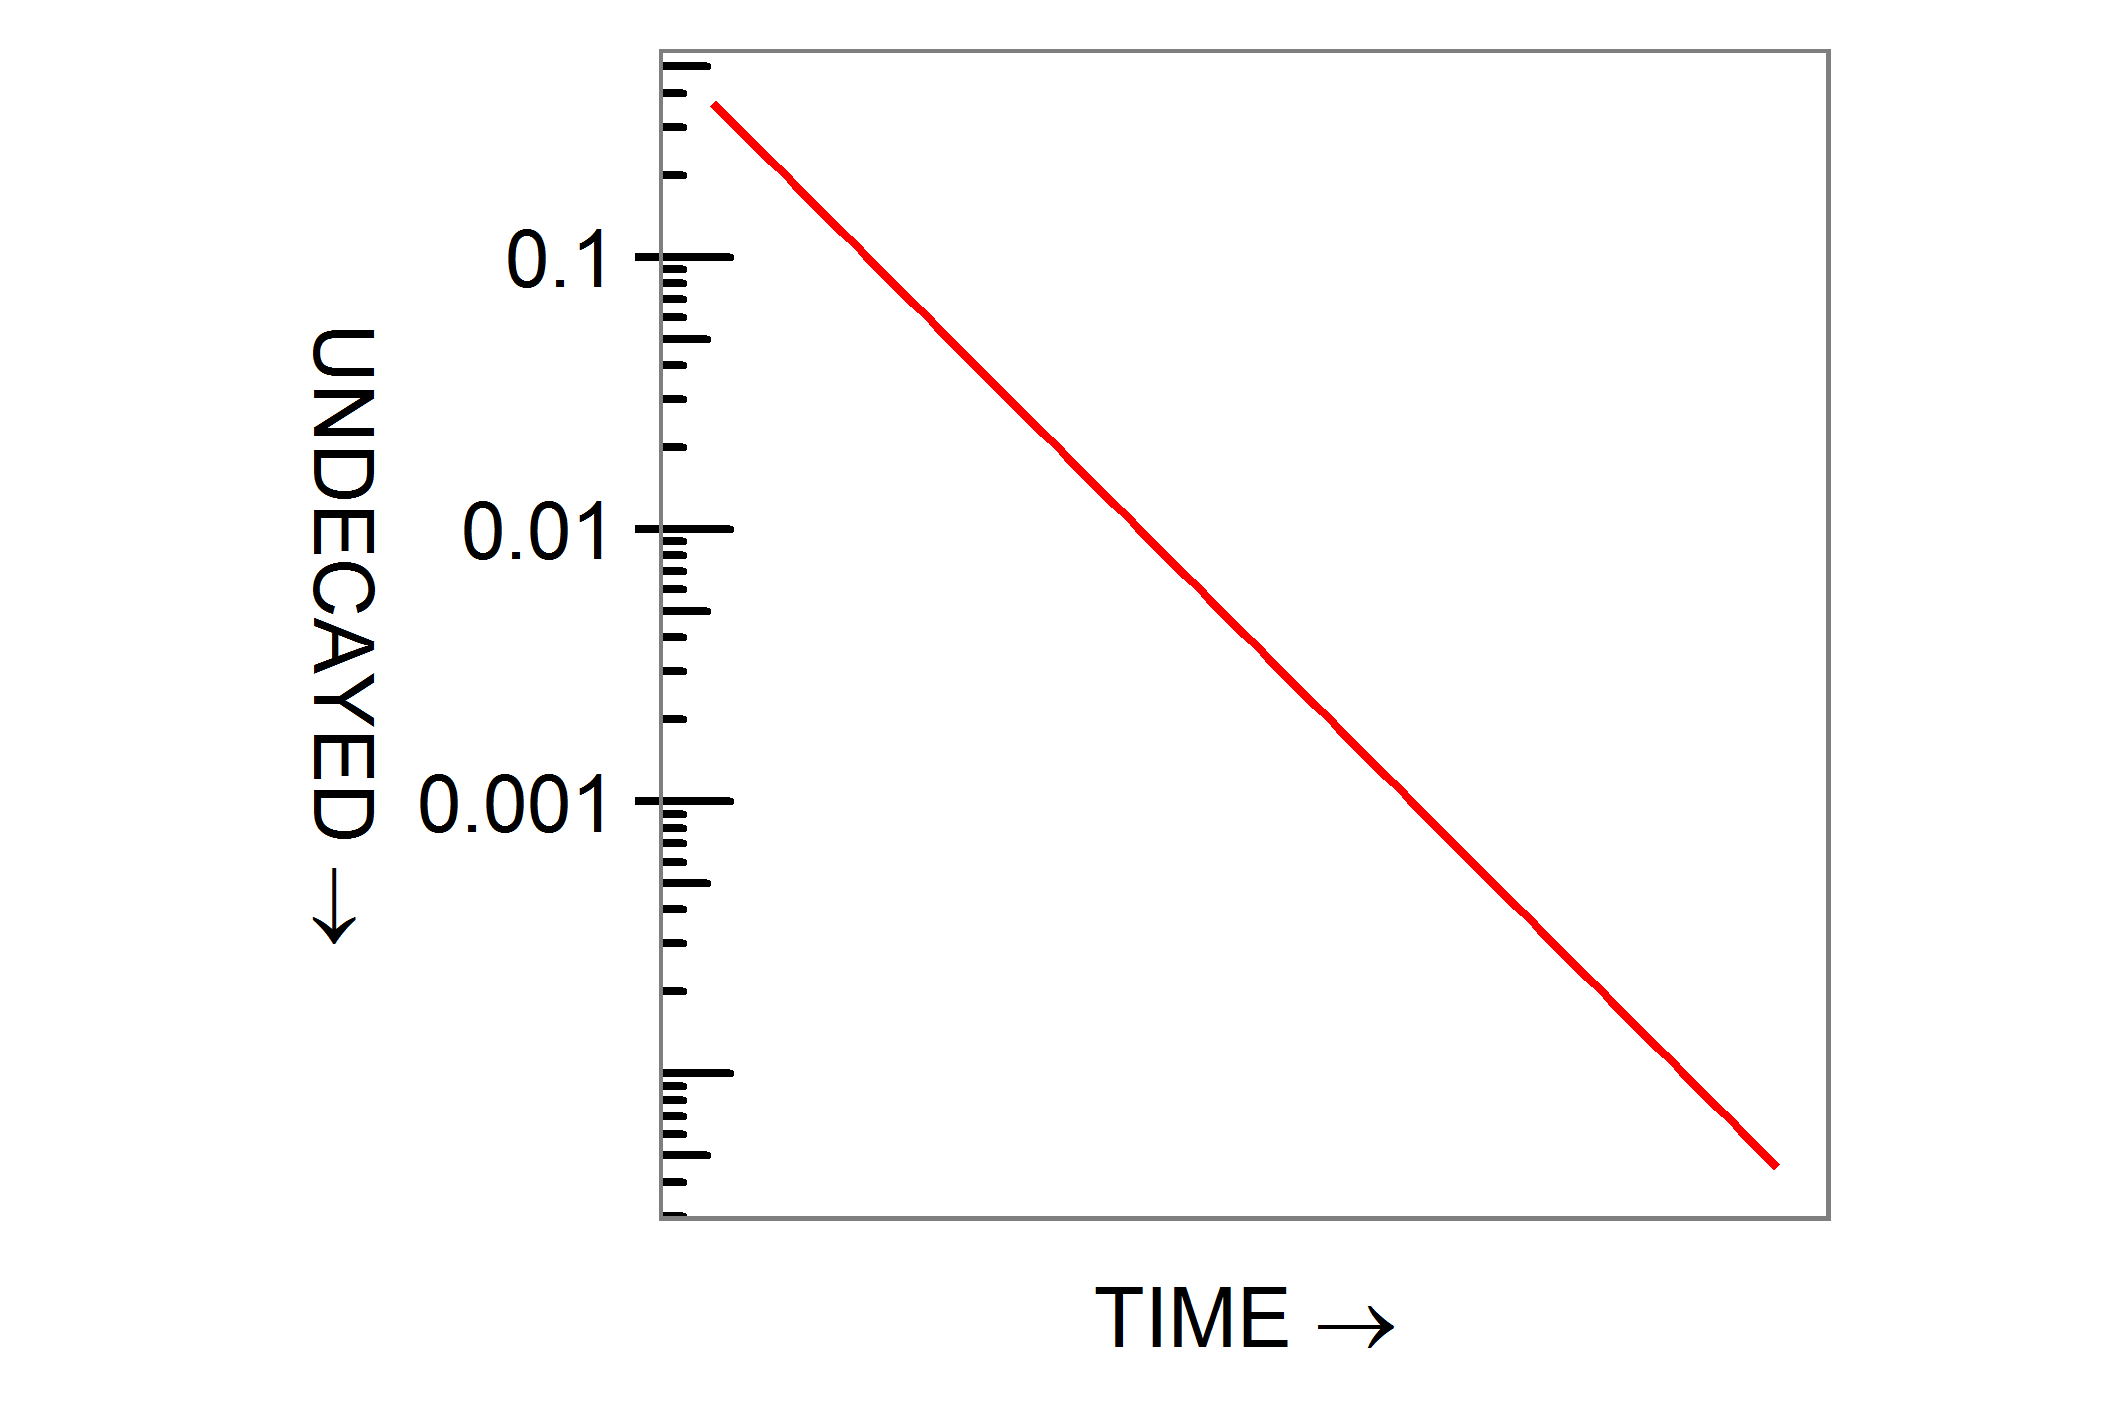
Take a gram of radium, leave it to decay for 1400 years, that being its half-life, and you will be left with half a gram. After 2800 years a quarter will remain, after 4200 an eighth and so on. This process of exponential decay is represented by the formula
exp(−ct)
What do the symbols mean? t represents time and c is a probability, the odds that any one single nucleus will decay in a given time. Give t the value 1400 years, give c the value specific to radium decay, and the expression evaluates to ½: if you want ¼, set t to 2800 years and so on. The minus sign gives exponential decay as distinct from increase. The exponential function exp(x) is related to the logarithm ln(x) and a graph of the expression as time t increases is a downward-sloping straight line when plotted on a logarithmic scale.
From nuclei to genes
Burch identified a number of diseases, including familial Mediterranean fever and a form of arthritis, which conformed to exactly this pattern: a half, a quarter, an eighth of susceptible individuals keep their health as infancy, youth and middle age pass by, and he had the straight line graphs to prove it. He constructed an expression to represent it:
Pt = S(1 − exp(−kt))
Here, Pt is the probability of disease after a given time t has elapsed: k is a hypothetical mutation rate, the probability that a gene – one stretch of one physical DNA molecule – will mutate like a nucleus decaying. S represents the percentage of people born with the pre-mutant gene. Of 100, 000 people it might be (where S = 1%) that 1000 susceptible people progressively sicken like a gram of radium decaying. Burch subtracted the exponential function from 1 because he was interested in the proportion of genes which do mutate (½, ¾, ⅞…) rather than those which do not.
Genes in cells, cells in organisms
Diseases associated with a single genetic mutation are the exception not the rule, and, on Burch’s theory, autoimmune disease might require the joint action of several mutated cells, two or three, say, rather than one. The full form of Burch’s expression reflects this:

Pt = S(1 − exp( −ktr))n
The superscripted powers r and n refer to genes and cells: if a cell goes rogue after three of its genes mutate, then r=3; and if two rogue cells are necessary to produce disease, then n=2. The overall probability of three mutations occurring is the product of their individual probabilities. The expression tr may seem strange. What would t3 mean? Cubic years? No. In this case, three concurrent stretches of time are involved and t3 is just a quantity which happens to be a cubic number. Burch assigned values such as 0.00001−3 to k so that the powers cancel out as you evaluate the formula. And the probability of two cells going rogue is just the square of the probability for one cell. Statisticians know this formula as the Weibull distribution (pronounced vay-bull): in these pages it is called the Burch curve.
Dead at 50 or dead by 50?
Finally, Burch often presents his expression in this form:
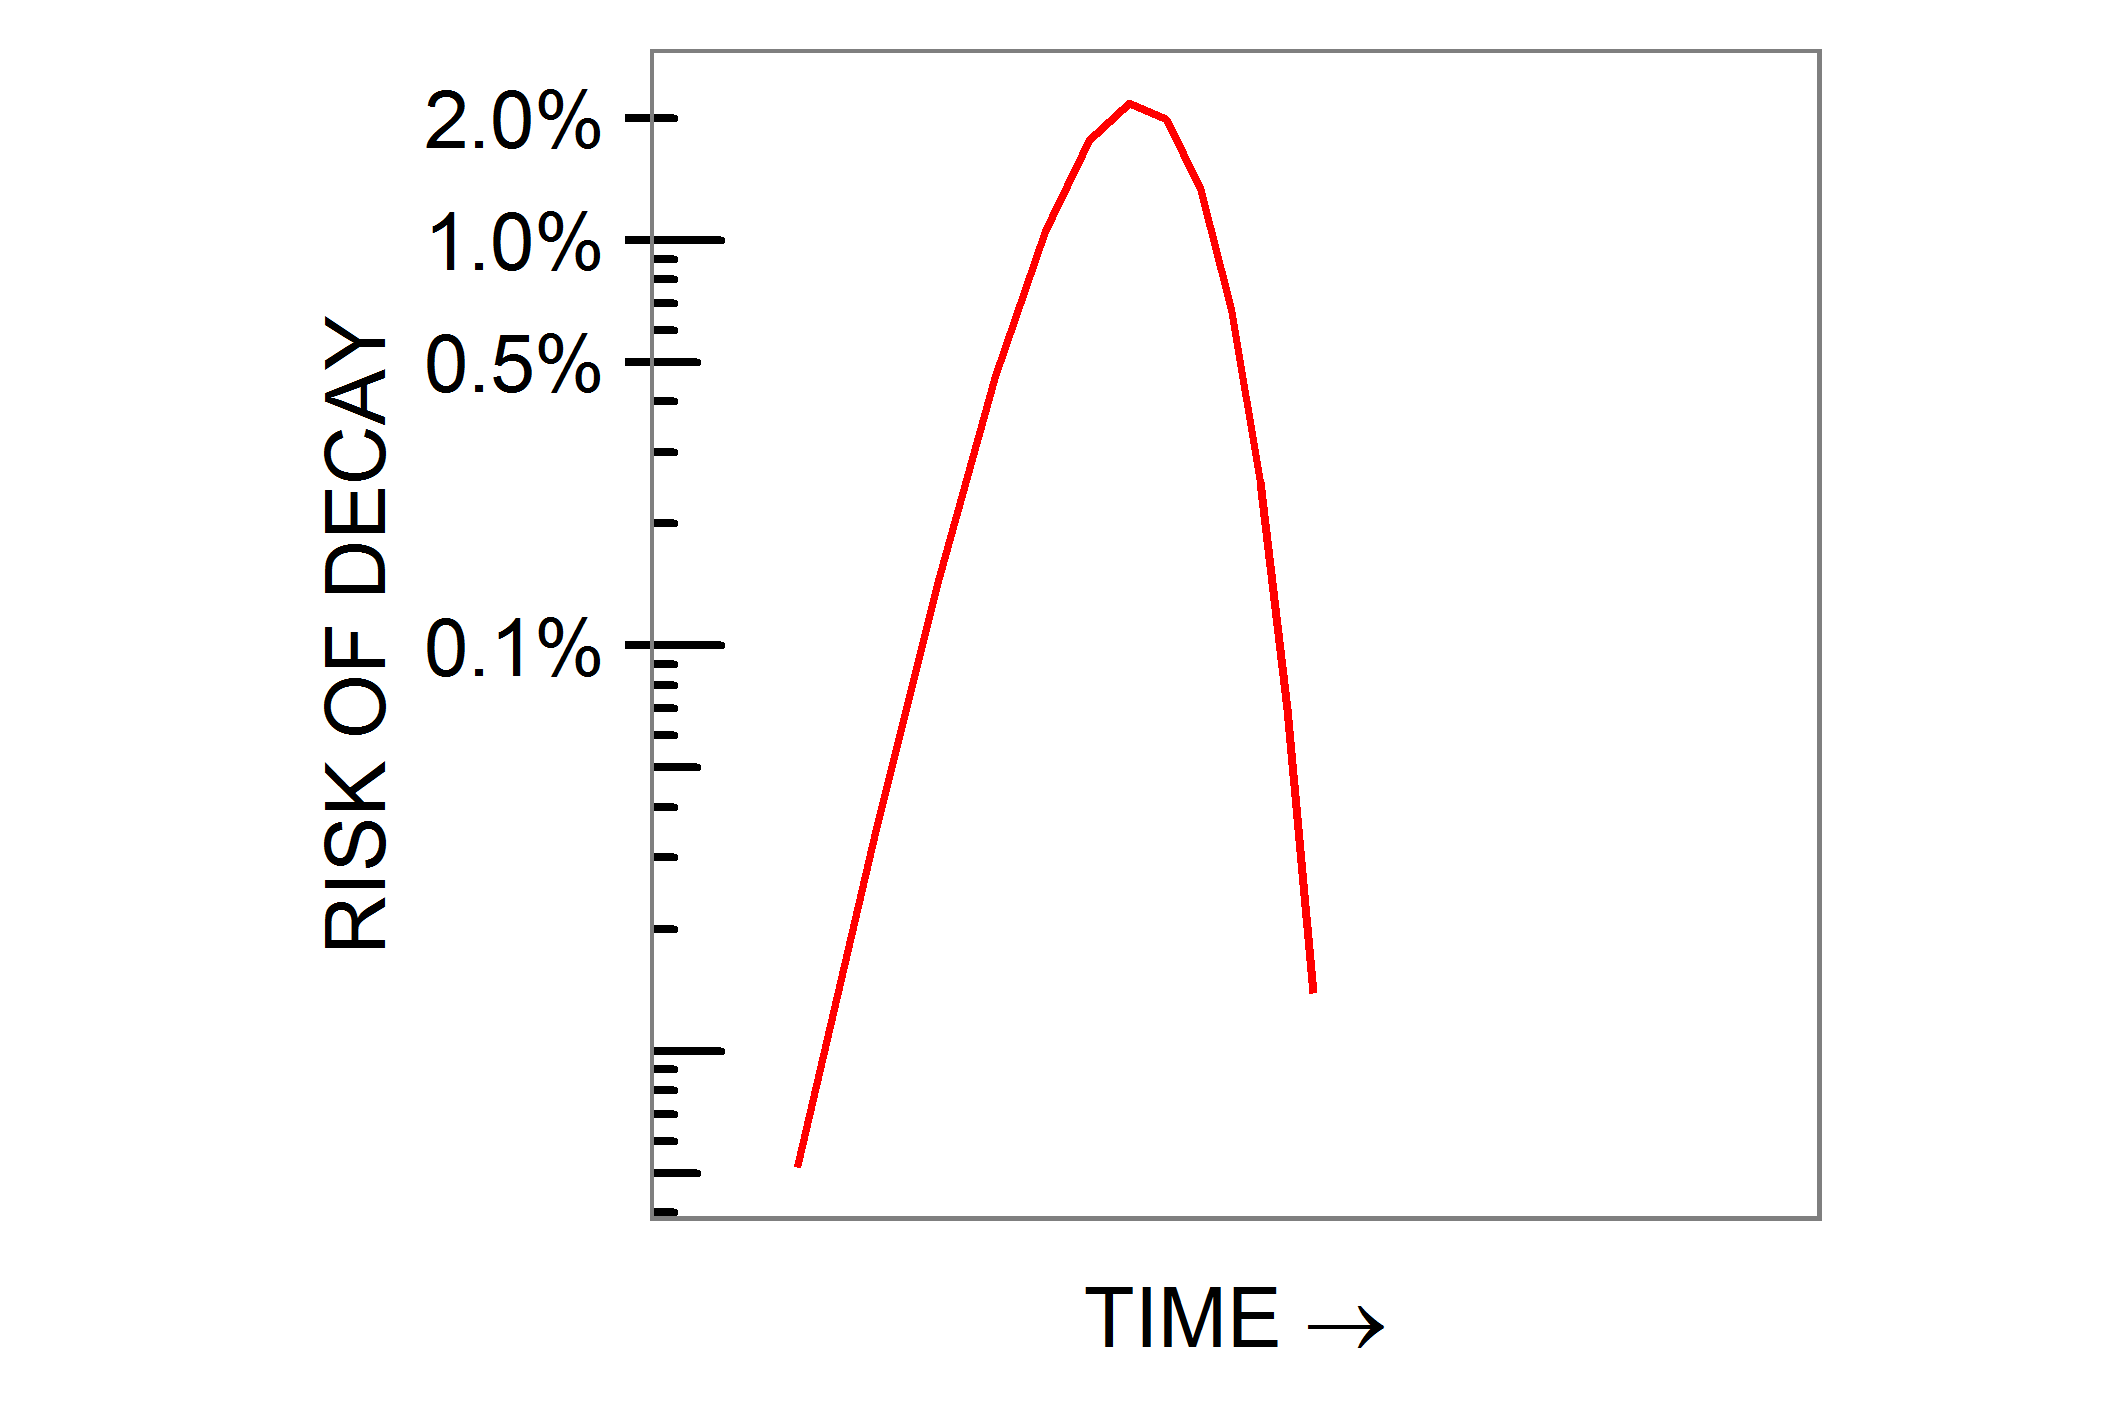
dP/dt = (n r k S t(r−1) exp(−ktr))(1 −exp(−ktr)) (n−1)
This calculus expression is the derivative of the shorter form and conveys the same information in a different way. When t is given a value such as 50 years, the shorter form tells us the number of people who will be affected by some disease by the age of 50; the longer form tells us how many will succumb aged exactly 50. You do not need to know calculus to use the longer formula, you simply need to know what question it answers – the probability of illness developing at a particular time.
“For the non-mathematician,” Burch conceded, the above formula “may appear rather formidable.” However, it is mathematical shorthand for a very simple biological model of disease and is conceptually just a few steps away from the expression exp(−ct).
A client-server theory of cancer
It is a standing mystery why the immune system does not destroy cancers in the same way as it rejects transplanted organs, by identifying the mutant cells as ‘not self’. Do cancer cells trick it or cause it to break down? Burch had his own explanation. His collaboration with Burwell persuaded him that healthy cells multiply under biochemical orders from the immune system and stabilise their numbers by signalling when orders have been obeyed. On this view, there is a communications loop between billions of cells in an organ such as the lungs or the liver and a smaller number of ‘growth control’ cells outside it, like clients and servers talking to each other on a computer network. The crucial point is that a relatively small number of cells transmit a chemical Start signal and millions of lung or liver cells collectively transmit the Stop signal. Mutations to a cell in an organ affecting the Stop signal it emits would be drowned out by a million other signals from healthy cells, whereas mutation to individual growth control cells could affect the Start signal transmitted to the entire organ.
Burch quantified this hypothesis on the same lines as with autoimmune disease, fitting theoretical curves to observation and coming up with encouraging results. His analyses of different forms of cancer focus on his parameters n and r, which he interpreted as a small number of mutations in a small number of cells (but not necessarily a single cell). If the mutations strike in the immune system, they need not be exactly the same as those seen in the resulting cancer cells. He envisaged the mutant growth control cells as expanding into what he called a ‘forbidden clone’. Many cancers progress through well defined stages, and these are often types which called for the parameter n to be greater than 1. The stages looked as if they were the effect of successive forbidden clones kicking in. Some cancers have several different forms, which Burch interpreted as having different values for his parameters, and some, including lung cancer, appeared to take different forms in men and women.
His biological theory is full of specifics which are most unlikely to be correct. “Recognition polypeptides comprise major and minor histocompatibility antigens, tissue-specific antigens and subtler determinants… Their mode of synthesis and assembly may well have certain parallels with that of immunoglobulins.” Far, far more is now known about growth in both normal cells and cancer cells than when he wrote those words in 1980. However, his curves do not stand or fall with everything he said. Two of his central theses
- 1 Cancer can originate in more than one cell
- 2 The originating cells need not all belong to the affected organ
had not been disproved as of 2014, and neither had a role for the immune system in cancer.
How many variables?
The simplest form of Burch’s formula, exp(−kt), only fits straight lines for different values of k. With the additional parameters n and r, it fits a large class of curves of varying shape. Clearly, the more parameters you add to a formula the more curves it will fit until it becomes a theory of everything, fitting all data. Burch was well aware of this danger, but it only arises if you can give your parameters any values you please, whereas his parameters only took values from a very restricted range.
S, the ‘susceptibles’ parameter, is a percentage of individuals in a population; therefore a real number between 0 and 1.
t, the time parameter, is a variable restricted to the human lifespan; measured in years it can hardly be less than 0 or more than 150.
k, the mutation constant, is a probability; a real number between 0 and 1. In Burch’s work on lung cancer it takes values between 10−9 and 10−12.
r, the genes parameter is a small integer lying between 1 and at most 12.
n, the cells parameter, is a small integer lying between 1 and about 5.
The parameters n and r are constant for any one particular disease. S and k are constant for any one disease in any one population but vary between populations living at different times and places. Burch held that some diseases, including lung cancer, take different forms in men and women involving different values of n and r.
The invisible parameter
One further parameter is involved in Burch’s theory. The age at which a disease strikes is estimated from age at diagnosis, which is often age at death, yet the biological processes causing it must have been triggered some time earlier. Burch termed the period between onset and diagnosis the latent period and symbolised it by a parameter ‘lambda’ λ. If life was simple, λ would be a fixed offset of so many months or years and Burch could just have appended +λ to his formula, but of course it is not. The latent period is different from disease to disease and is often a function of age. Burch did not have a general explanation of the pattern and could not formalise it. The value of λ has to be considerably less than the human lifespan and can never be negative.